African vs Comanche No Schooling Completed
COMPARE
African
Comanche
No Schooling Completed
No Schooling Completed Comparison
Africans
Comanche
2.2%
NO SCHOOLING COMPLETED
21.8/ 100
METRIC RATING
199th/ 347
METRIC RANK
2.1%
NO SCHOOLING COMPLETED
60.7/ 100
METRIC RATING
164th/ 347
METRIC RANK
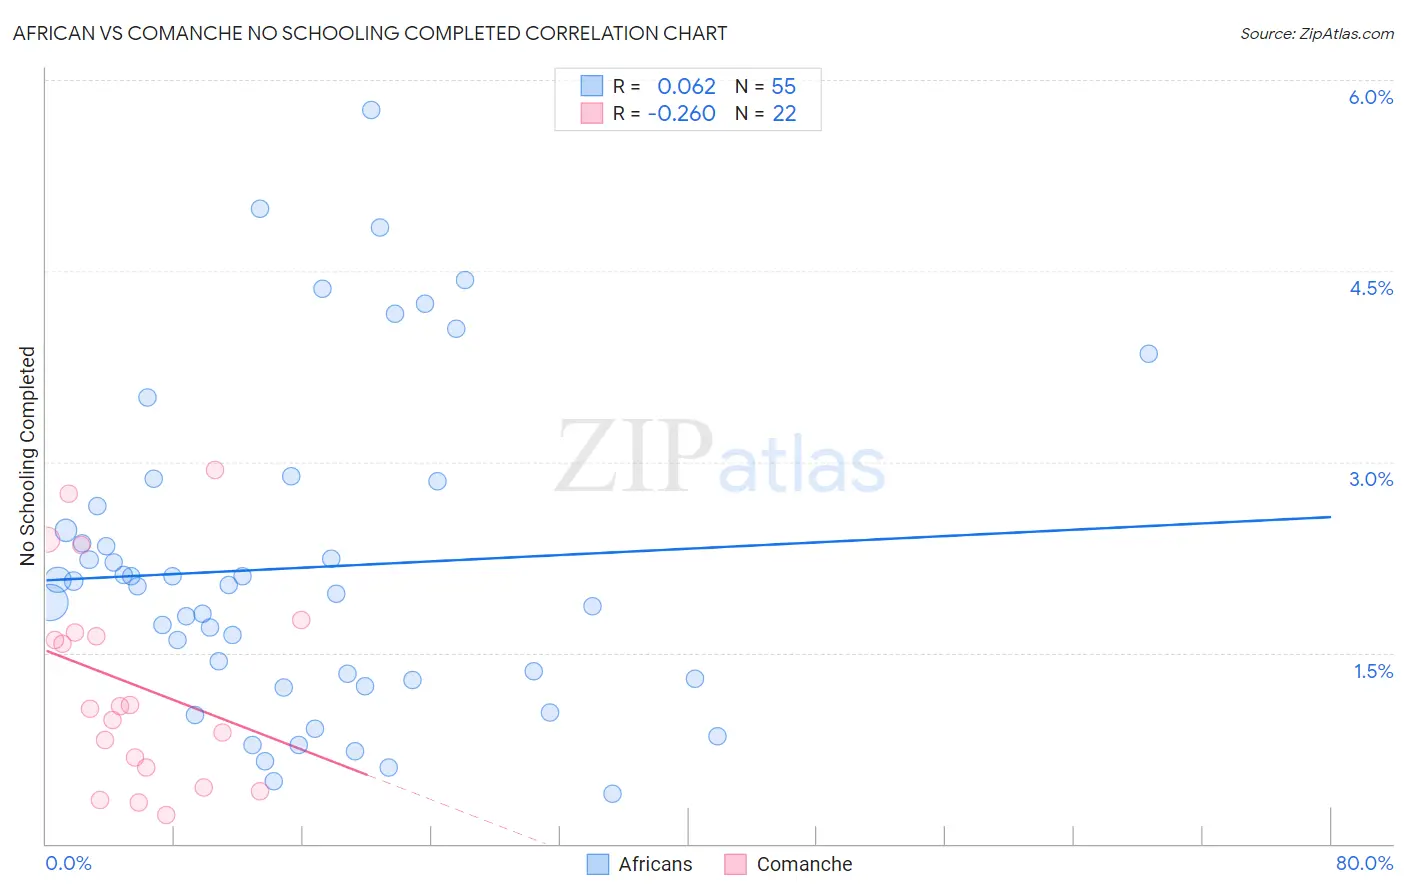
African vs Comanche No Schooling Completed Correlation Chart
The statistical analysis conducted on geographies consisting of 465,007,886 people shows a slight positive correlation between the proportion of Africans and percentage of population with no schooling in the United States with a correlation coefficient (R) of 0.062 and weighted average of 2.2%. Similarly, the statistical analysis conducted on geographies consisting of 109,390,428 people shows a weak negative correlation between the proportion of Comanche and percentage of population with no schooling in the United States with a correlation coefficient (R) of -0.260 and weighted average of 2.1%, a difference of 5.8%.
No Schooling Completed Correlation Summary
| Measurement | African | Comanche |
| Minimum | 0.39% | 0.23% |
| Maximum | 5.8% | 2.9% |
| Range | 5.4% | 2.7% |
| Mean | 2.2% | 1.3% |
| Median | 2.0% | 1.1% |
| Interquartile 25% (IQ1) | 1.3% | 0.59% |
| Interquartile 75% (IQ3) | 2.7% | 1.7% |
| Interquartile Range (IQR) | 1.4% | 1.1% |
| Standard Deviation (Sample) | 1.3% | 0.81% |
| Standard Deviation (Population) | 1.2% | 0.79% |
Similar Demographics by No Schooling Completed
Demographics Similar to Africans by No Schooling Completed
In terms of no schooling completed, the demographic groups most similar to Africans are Immigrants from Chile (2.2%, a difference of 0.17%), Immigrants from Southern Europe (2.2%, a difference of 0.35%), Immigrants from Northern Africa (2.2%, a difference of 0.46%), Immigrants from Ukraine (2.2%, a difference of 0.77%), and Hawaiian (2.2%, a difference of 0.92%).
| Demographics | Rating | Rank | No Schooling Completed |
| Guamanians/Chamorros | 29.8 /100 | #192 | Fair 2.2% |
| Paraguayans | 29.3 /100 | #193 | Fair 2.2% |
| Immigrants | Albania | 28.3 /100 | #194 | Fair 2.2% |
| Hawaiians | 27.0 /100 | #195 | Fair 2.2% |
| Immigrants | Ukraine | 26.1 /100 | #196 | Fair 2.2% |
| Immigrants | Southern Europe | 23.8 /100 | #197 | Fair 2.2% |
| Immigrants | Chile | 22.7 /100 | #198 | Fair 2.2% |
| Africans | 21.8 /100 | #199 | Fair 2.2% |
| Immigrants | Northern Africa | 19.5 /100 | #200 | Poor 2.2% |
| Costa Ricans | 17.1 /100 | #201 | Poor 2.2% |
| Moroccans | 13.7 /100 | #202 | Poor 2.2% |
| Laotians | 13.3 /100 | #203 | Poor 2.2% |
| Hopi | 12.9 /100 | #204 | Poor 2.2% |
| Immigrants | Bahamas | 11.6 /100 | #205 | Poor 2.2% |
| Bahamians | 11.6 /100 | #206 | Poor 2.2% |
Demographics Similar to Comanche by No Schooling Completed
In terms of no schooling completed, the demographic groups most similar to Comanche are Brazilian (2.1%, a difference of 0.060%), Dutch West Indian (2.1%, a difference of 0.11%), Egyptian (2.1%, a difference of 0.21%), Albanian (2.1%, a difference of 0.22%), and Cheyenne (2.1%, a difference of 0.29%).
| Demographics | Rating | Rank | No Schooling Completed |
| Immigrants | Sri Lanka | 67.0 /100 | #157 | Good 2.0% |
| Immigrants | Korea | 66.7 /100 | #158 | Good 2.0% |
| Immigrants | Spain | 66.4 /100 | #159 | Good 2.0% |
| Kenyans | 65.7 /100 | #160 | Good 2.0% |
| Ugandans | 64.6 /100 | #161 | Good 2.0% |
| Immigrants | Brazil | 63.8 /100 | #162 | Good 2.1% |
| Albanians | 62.2 /100 | #163 | Good 2.1% |
| Comanche | 60.7 /100 | #164 | Good 2.1% |
| Brazilians | 60.2 /100 | #165 | Good 2.1% |
| Dutch West Indians | 59.9 /100 | #166 | Average 2.1% |
| Egyptians | 59.2 /100 | #167 | Average 2.1% |
| Cheyenne | 58.6 /100 | #168 | Average 2.1% |
| Apache | 56.7 /100 | #169 | Average 2.1% |
| Argentineans | 56.0 /100 | #170 | Average 2.1% |
| Immigrants | Poland | 55.2 /100 | #171 | Average 2.1% |