Assyrian/Chaldean/Syriac vs Immigrants from Eritrea Child Poverty Under the Age of 5
COMPARE
Assyrian/Chaldean/Syriac
Immigrants from Eritrea
Child Poverty Under the Age of 5
Child Poverty Under the Age of 5 Comparison
Assyrians/Chaldeans/Syriacs
Immigrants from Eritrea
13.6%
CHILD POVERTY UNDER THE AGE OF 5
100.0/ 100
METRIC RATING
17th/ 347
METRIC RANK
19.1%
CHILD POVERTY UNDER THE AGE OF 5
1.5/ 100
METRIC RATING
226th/ 347
METRIC RANK
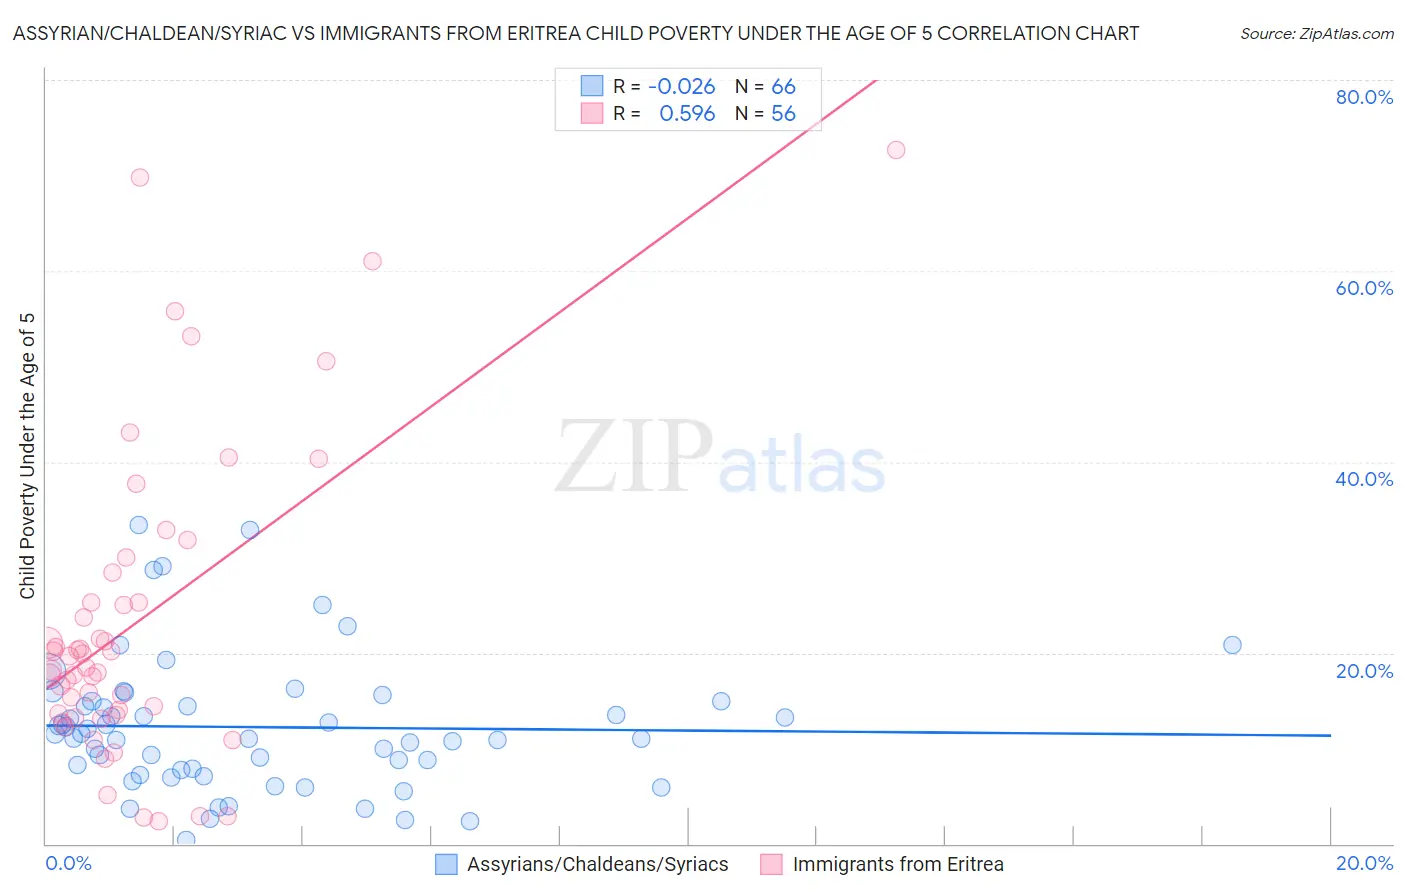
Assyrian/Chaldean/Syriac vs Immigrants from Eritrea Child Poverty Under the Age of 5 Correlation Chart
The statistical analysis conducted on geographies consisting of 107,938,330 people shows no correlation between the proportion of Assyrians/Chaldeans/Syriacs and poverty level among children under the age of 5 in the United States with a correlation coefficient (R) of -0.026 and weighted average of 13.6%. Similarly, the statistical analysis conducted on geographies consisting of 103,980,872 people shows a substantial positive correlation between the proportion of Immigrants from Eritrea and poverty level among children under the age of 5 in the United States with a correlation coefficient (R) of 0.596 and weighted average of 19.1%, a difference of 40.7%.
Child Poverty Under the Age of 5 Correlation Summary
| Measurement | Assyrian/Chaldean/Syriac | Immigrants from Eritrea |
| Minimum | 0.41% | 2.3% |
| Maximum | 33.4% | 72.7% |
| Range | 33.0% | 70.4% |
| Mean | 12.2% | 23.3% |
| Median | 11.3% | 19.0% |
| Interquartile 25% (IQ1) | 7.7% | 13.6% |
| Interquartile 75% (IQ3) | 14.9% | 26.8% |
| Interquartile Range (IQR) | 7.2% | 13.2% |
| Standard Deviation (Sample) | 7.0% | 16.1% |
| Standard Deviation (Population) | 6.9% | 15.9% |
Similar Demographics by Child Poverty Under the Age of 5
Demographics Similar to Assyrians/Chaldeans/Syriacs by Child Poverty Under the Age of 5
In terms of child poverty under the age of 5, the demographic groups most similar to Assyrians/Chaldeans/Syriacs are Immigrants from China (13.6%, a difference of 0.29%), Immigrants from Eastern Asia (13.5%, a difference of 0.34%), Indian (Asian) (13.4%, a difference of 0.86%), Okinawan (13.4%, a difference of 0.91%), and Immigrants from Ireland (13.7%, a difference of 1.2%).
| Demographics | Rating | Rank | Child Poverty Under the Age of 5 |
| Burmese | 100.0 /100 | #10 | Exceptional 13.2% |
| Immigrants | Korea | 100.0 /100 | #11 | Exceptional 13.2% |
| Immigrants | South Central Asia | 100.0 /100 | #12 | Exceptional 13.3% |
| Bhutanese | 100.0 /100 | #13 | Exceptional 13.4% |
| Okinawans | 100.0 /100 | #14 | Exceptional 13.4% |
| Indians (Asian) | 100.0 /100 | #15 | Exceptional 13.4% |
| Immigrants | Eastern Asia | 100.0 /100 | #16 | Exceptional 13.5% |
| Assyrians/Chaldeans/Syriacs | 100.0 /100 | #17 | Exceptional 13.6% |
| Immigrants | China | 100.0 /100 | #18 | Exceptional 13.6% |
| Immigrants | Ireland | 100.0 /100 | #19 | Exceptional 13.7% |
| Immigrants | Japan | 100.0 /100 | #20 | Exceptional 13.8% |
| Bolivians | 100.0 /100 | #21 | Exceptional 13.8% |
| Immigrants | Bolivia | 100.0 /100 | #22 | Exceptional 13.8% |
| Bulgarians | 99.9 /100 | #23 | Exceptional 13.9% |
| Asians | 99.9 /100 | #24 | Exceptional 14.0% |
Demographics Similar to Immigrants from Eritrea by Child Poverty Under the Age of 5
In terms of child poverty under the age of 5, the demographic groups most similar to Immigrants from Eritrea are Nigerian (19.1%, a difference of 0.020%), Nicaraguan (19.1%, a difference of 0.050%), Cuban (19.1%, a difference of 0.16%), Alsatian (19.1%, a difference of 0.18%), and Cape Verdean (19.1%, a difference of 0.18%).
| Demographics | Rating | Rank | Child Poverty Under the Age of 5 |
| German Russians | 3.0 /100 | #219 | Tragic 18.8% |
| Immigrants | Azores | 2.6 /100 | #220 | Tragic 18.9% |
| Immigrants | Nigeria | 2.1 /100 | #221 | Tragic 19.0% |
| Alsatians | 1.7 /100 | #222 | Tragic 19.1% |
| Cubans | 1.7 /100 | #223 | Tragic 19.1% |
| Nicaraguans | 1.6 /100 | #224 | Tragic 19.1% |
| Nigerians | 1.6 /100 | #225 | Tragic 19.1% |
| Immigrants | Eritrea | 1.5 /100 | #226 | Tragic 19.1% |
| Cape Verdeans | 1.4 /100 | #227 | Tragic 19.1% |
| Immigrants | Sudan | 1.3 /100 | #228 | Tragic 19.2% |
| Ghanaians | 1.2 /100 | #229 | Tragic 19.2% |
| Ecuadorians | 1.2 /100 | #230 | Tragic 19.2% |
| Bermudans | 1.2 /100 | #231 | Tragic 19.2% |
| Trinidadians and Tobagonians | 0.9 /100 | #232 | Tragic 19.3% |
| Sudanese | 0.9 /100 | #233 | Tragic 19.3% |