Tlingit-Haida vs Immigrants from Barbados Married-Couple Family Poverty
COMPARE
Tlingit-Haida
Immigrants from Barbados
Married-Couple Family Poverty
Married-Couple Family Poverty Comparison
Tlingit-Haida
Immigrants from Barbados
4.4%
MARRIED-COUPLE FAMILY POVERTY
99.6/ 100
METRIC RATING
60th/ 347
METRIC RANK
6.5%
MARRIED-COUPLE FAMILY POVERTY
0.0/ 100
METRIC RATING
290th/ 347
METRIC RANK
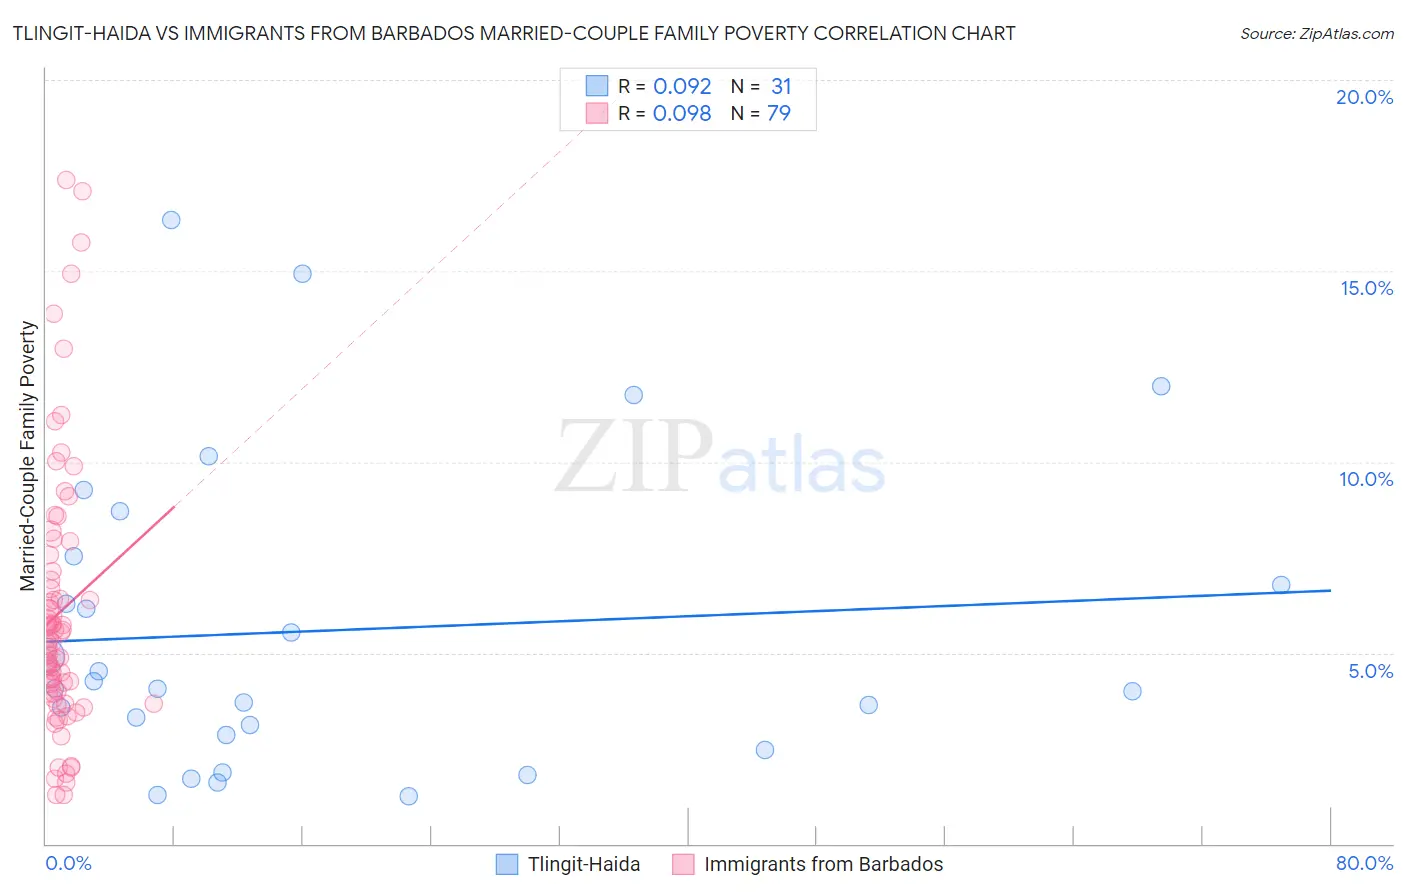
Tlingit-Haida vs Immigrants from Barbados Married-Couple Family Poverty Correlation Chart
The statistical analysis conducted on geographies consisting of 60,624,230 people shows a slight positive correlation between the proportion of Tlingit-Haida and poverty level among married-couple families in the United States with a correlation coefficient (R) of 0.092 and weighted average of 4.4%. Similarly, the statistical analysis conducted on geographies consisting of 112,495,981 people shows a slight positive correlation between the proportion of Immigrants from Barbados and poverty level among married-couple families in the United States with a correlation coefficient (R) of 0.098 and weighted average of 6.5%, a difference of 49.6%.
Married-Couple Family Poverty Correlation Summary
| Measurement | Tlingit-Haida | Immigrants from Barbados |
| Minimum | 1.3% | 1.3% |
| Maximum | 16.3% | 17.4% |
| Range | 15.1% | 16.1% |
| Mean | 5.6% | 6.1% |
| Median | 4.1% | 5.2% |
| Interquartile 25% (IQ1) | 2.8% | 3.9% |
| Interquartile 75% (IQ3) | 7.5% | 7.1% |
| Interquartile Range (IQR) | 4.7% | 3.2% |
| Standard Deviation (Sample) | 4.0% | 3.5% |
| Standard Deviation (Population) | 3.9% | 3.5% |
Similar Demographics by Married-Couple Family Poverty
Demographics Similar to Tlingit-Haida by Married-Couple Family Poverty
In terms of married-couple family poverty, the demographic groups most similar to Tlingit-Haida are Immigrants from Sweden (4.4%, a difference of 0.070%), Okinawan (4.4%, a difference of 0.11%), Immigrants from Australia (4.4%, a difference of 0.12%), Immigrants from Sri Lanka (4.4%, a difference of 0.49%), and Czechoslovakian (4.4%, a difference of 0.62%).
| Demographics | Rating | Rank | Married-Couple Family Poverty |
| Welsh | 99.7 /100 | #53 | Exceptional 4.3% |
| Austrians | 99.7 /100 | #54 | Exceptional 4.3% |
| French | 99.7 /100 | #55 | Exceptional 4.3% |
| Immigrants | Zimbabwe | 99.7 /100 | #56 | Exceptional 4.3% |
| Immigrants | Netherlands | 99.7 /100 | #57 | Exceptional 4.3% |
| Czechoslovakians | 99.7 /100 | #58 | Exceptional 4.4% |
| Immigrants | Sweden | 99.6 /100 | #59 | Exceptional 4.4% |
| Tlingit-Haida | 99.6 /100 | #60 | Exceptional 4.4% |
| Okinawans | 99.6 /100 | #61 | Exceptional 4.4% |
| Immigrants | Australia | 99.6 /100 | #62 | Exceptional 4.4% |
| Immigrants | Sri Lanka | 99.6 /100 | #63 | Exceptional 4.4% |
| Immigrants | Bulgaria | 99.5 /100 | #64 | Exceptional 4.4% |
| Macedonians | 99.4 /100 | #65 | Exceptional 4.4% |
| Immigrants | Serbia | 99.4 /100 | #66 | Exceptional 4.4% |
| Immigrants | Canada | 99.4 /100 | #67 | Exceptional 4.4% |
Demographics Similar to Immigrants from Barbados by Married-Couple Family Poverty
In terms of married-couple family poverty, the demographic groups most similar to Immigrants from Barbados are Belizean (6.5%, a difference of 0.040%), Immigrants from Lebanon (6.6%, a difference of 0.21%), Nepalese (6.5%, a difference of 0.23%), Arapaho (6.6%, a difference of 0.29%), and Salvadoran (6.5%, a difference of 0.40%).
| Demographics | Rating | Rank | Married-Couple Family Poverty |
| Ute | 0.0 /100 | #283 | Tragic 6.4% |
| Dutch West Indians | 0.0 /100 | #284 | Tragic 6.4% |
| Blacks/African Americans | 0.0 /100 | #285 | Tragic 6.5% |
| Guyanese | 0.0 /100 | #286 | Tragic 6.5% |
| Ecuadorians | 0.0 /100 | #287 | Tragic 6.5% |
| Salvadorans | 0.0 /100 | #288 | Tragic 6.5% |
| Nepalese | 0.0 /100 | #289 | Tragic 6.5% |
| Immigrants | Barbados | 0.0 /100 | #290 | Tragic 6.5% |
| Belizeans | 0.0 /100 | #291 | Tragic 6.5% |
| Immigrants | Lebanon | 0.0 /100 | #292 | Tragic 6.6% |
| Arapaho | 0.0 /100 | #293 | Tragic 6.6% |
| Bahamians | 0.0 /100 | #294 | Tragic 6.6% |
| Immigrants | Uzbekistan | 0.0 /100 | #295 | Tragic 6.6% |
| U.S. Virgin Islanders | 0.0 /100 | #296 | Tragic 6.6% |
| Kiowa | 0.0 /100 | #297 | Tragic 6.6% |