Inupiat vs White/Caucasian Single Female Poverty
COMPARE
Inupiat
White/Caucasian
Single Female Poverty
Single Female Poverty Comparison
Inupiat
Whites/Caucasians
23.1%
SINGLE FEMALE POVERTY
0.2/ 100
METRIC RATING
270th/ 347
METRIC RANK
22.7%
SINGLE FEMALE POVERTY
0.6/ 100
METRIC RATING
259th/ 347
METRIC RANK
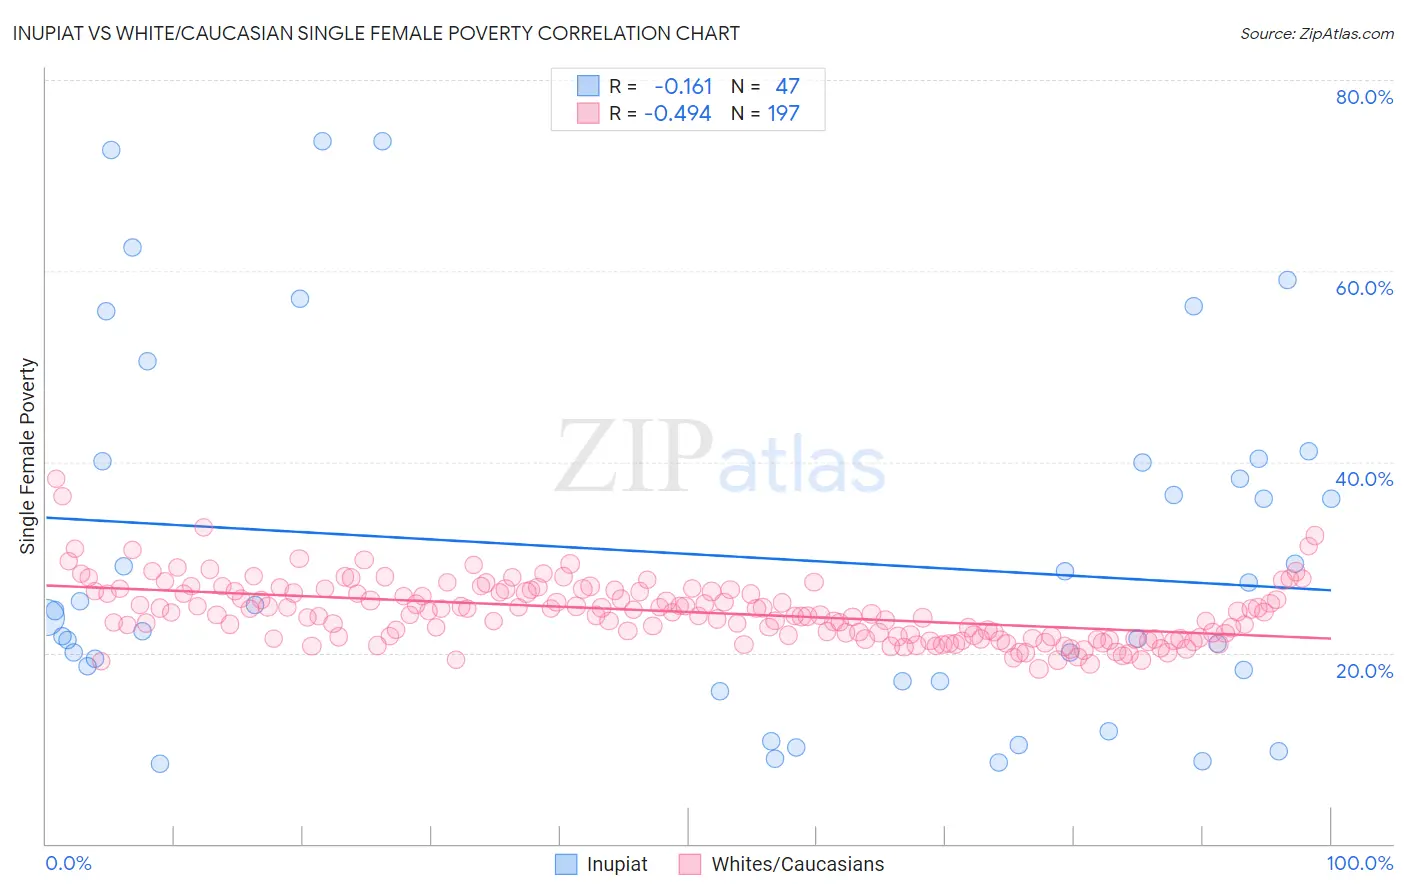
Inupiat vs White/Caucasian Single Female Poverty Correlation Chart
The statistical analysis conducted on geographies consisting of 95,986,972 people shows a poor negative correlation between the proportion of Inupiat and poverty level among single females in the United States with a correlation coefficient (R) of -0.161 and weighted average of 23.1%. Similarly, the statistical analysis conducted on geographies consisting of 560,395,051 people shows a moderate negative correlation between the proportion of Whites/Caucasians and poverty level among single females in the United States with a correlation coefficient (R) of -0.494 and weighted average of 22.7%, a difference of 1.9%.
Single Female Poverty Correlation Summary
| Measurement | Inupiat | White/Caucasian |
| Minimum | 8.3% | 18.3% |
| Maximum | 73.6% | 38.3% |
| Range | 65.3% | 20.0% |
| Mean | 30.3% | 24.3% |
| Median | 24.4% | 24.0% |
| Interquartile 25% (IQ1) | 17.1% | 21.6% |
| Interquartile 75% (IQ3) | 40.1% | 26.4% |
| Interquartile Range (IQR) | 23.1% | 4.8% |
| Standard Deviation (Sample) | 18.6% | 3.2% |
| Standard Deviation (Population) | 18.4% | 3.2% |
Demographics Similar to Inupiat and Whites/Caucasians by Single Female Poverty
In terms of single female poverty, the demographic groups most similar to Inupiat are Subsaharan African (23.2%, a difference of 0.25%), Hmong (23.1%, a difference of 0.26%), Fijian (23.1%, a difference of 0.28%), Senegalese (23.0%, a difference of 0.35%), and Immigrants from Micronesia (23.0%, a difference of 0.41%). Similarly, the demographic groups most similar to Whites/Caucasians are Celtic (22.7%, a difference of 0.080%), Bahamian (22.7%, a difference of 0.14%), Sudanese (22.6%, a difference of 0.34%), Immigrants from Cabo Verde (22.8%, a difference of 0.34%), and Immigrants from Belize (22.6%, a difference of 0.48%).
| Demographics | Rating | Rank | Single Female Poverty |
| Immigrants | Burma/Myanmar | 0.8 /100 | #254 | Tragic 22.6% |
| Immigrants | Sudan | 0.8 /100 | #255 | Tragic 22.6% |
| Immigrants | Belize | 0.8 /100 | #256 | Tragic 22.6% |
| Sudanese | 0.7 /100 | #257 | Tragic 22.6% |
| Bahamians | 0.6 /100 | #258 | Tragic 22.7% |
| Whites/Caucasians | 0.6 /100 | #259 | Tragic 22.7% |
| Celtics | 0.5 /100 | #260 | Tragic 22.7% |
| Immigrants | Cabo Verde | 0.4 /100 | #261 | Tragic 22.8% |
| British West Indians | 0.4 /100 | #262 | Tragic 22.8% |
| Scotch-Irish | 0.3 /100 | #263 | Tragic 22.9% |
| Immigrants | Laos | 0.3 /100 | #264 | Tragic 22.9% |
| Central Americans | 0.2 /100 | #265 | Tragic 23.0% |
| Immigrants | Micronesia | 0.2 /100 | #266 | Tragic 23.0% |
| Senegalese | 0.2 /100 | #267 | Tragic 23.0% |
| Fijians | 0.2 /100 | #268 | Tragic 23.1% |
| Hmong | 0.2 /100 | #269 | Tragic 23.1% |
| Inupiat | 0.2 /100 | #270 | Tragic 23.1% |
| Sub-Saharan Africans | 0.1 /100 | #271 | Tragic 23.2% |
| Immigrants | Senegal | 0.1 /100 | #272 | Tragic 23.2% |
| Alaska Natives | 0.1 /100 | #273 | Tragic 23.3% |
| Marshallese | 0.1 /100 | #274 | Tragic 23.3% |