Tsimshian vs White/Caucasian Poverty
COMPARE
Tsimshian
White/Caucasian
Poverty
Poverty Comparison
Tsimshian
Whites/Caucasians
13.0%
POVERTY
9.2/ 100
METRIC RATING
205th/ 347
METRIC RANK
12.3%
POVERTY
55.4/ 100
METRIC RATING
169th/ 347
METRIC RANK
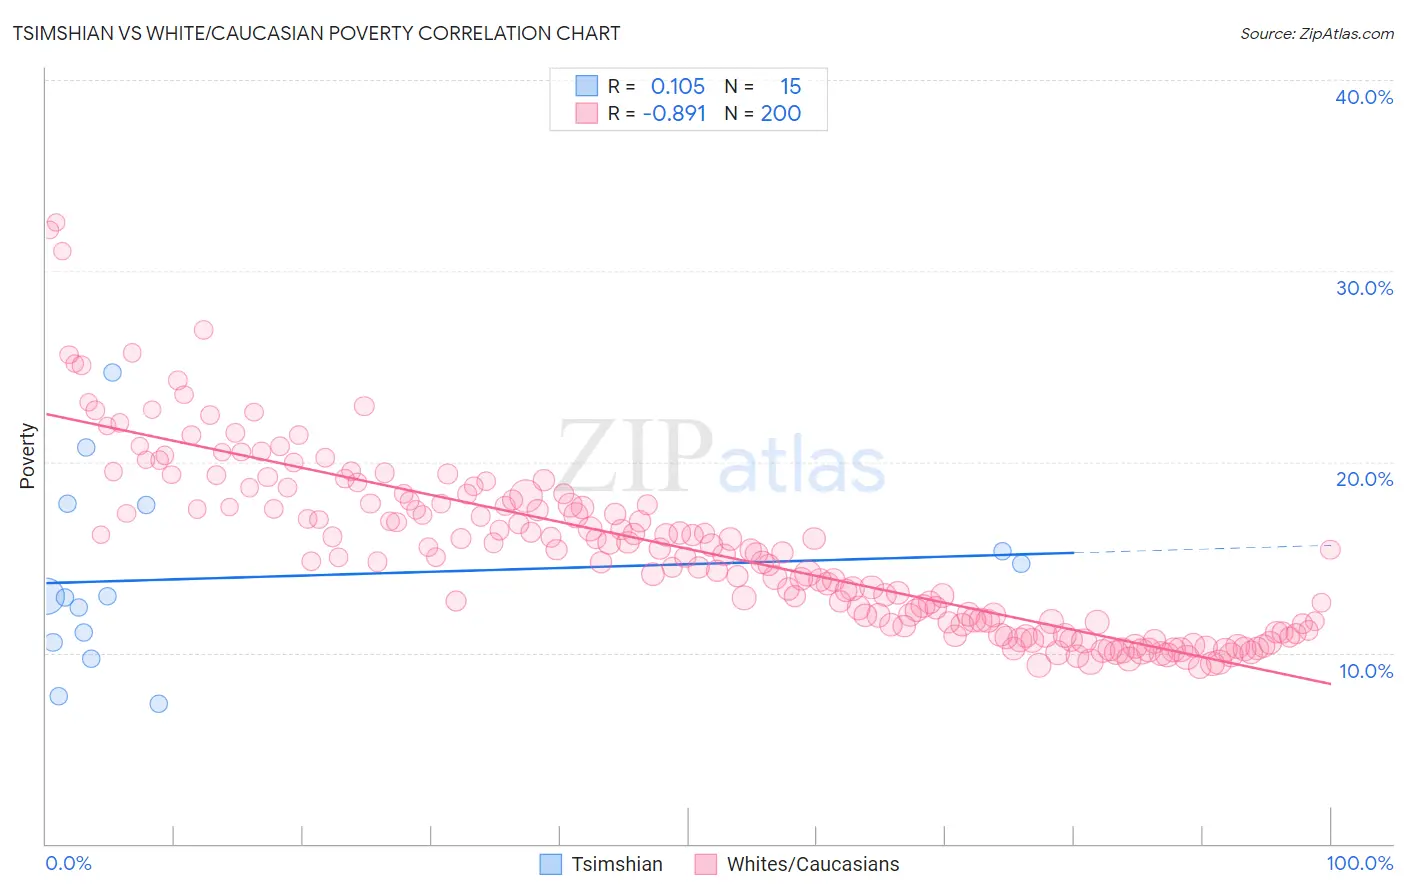
Tsimshian vs White/Caucasian Poverty Correlation Chart
The statistical analysis conducted on geographies consisting of 15,626,462 people shows a poor positive correlation between the proportion of Tsimshian and poverty level in the United States with a correlation coefficient (R) of 0.105 and weighted average of 13.0%. Similarly, the statistical analysis conducted on geographies consisting of 583,792,023 people shows a very strong negative correlation between the proportion of Whites/Caucasians and poverty level in the United States with a correlation coefficient (R) of -0.891 and weighted average of 12.3%, a difference of 6.1%.
Poverty Correlation Summary
| Measurement | Tsimshian | White/Caucasian |
| Minimum | 7.3% | 9.2% |
| Maximum | 24.7% | 32.6% |
| Range | 17.4% | 23.3% |
| Mean | 13.9% | 15.4% |
| Median | 12.9% | 15.2% |
| Interquartile 25% (IQ1) | 10.5% | 11.5% |
| Interquartile 75% (IQ3) | 17.7% | 18.0% |
| Interquartile Range (IQR) | 7.2% | 6.5% |
| Standard Deviation (Sample) | 4.8% | 4.6% |
| Standard Deviation (Population) | 4.6% | 4.6% |
Similar Demographics by Poverty
Demographics Similar to Tsimshian by Poverty
In terms of poverty, the demographic groups most similar to Tsimshian are Immigrants from Eastern Africa (13.1%, a difference of 0.70%), Panamanian (13.1%, a difference of 0.82%), Ugandan (13.1%, a difference of 0.98%), Malaysian (13.1%, a difference of 1.0%), and Immigrants from the Azores (13.1%, a difference of 1.0%).
| Demographics | Rating | Rank | Poverty |
| Spanish | 18.7 /100 | #198 | Poor 12.8% |
| Immigrants | Kenya | 17.5 /100 | #199 | Poor 12.8% |
| Spaniards | 16.5 /100 | #200 | Poor 12.8% |
| Immigrants | Uganda | 16.5 /100 | #201 | Poor 12.8% |
| Immigrants | Uruguay | 15.6 /100 | #202 | Poor 12.8% |
| Hmong | 15.0 /100 | #203 | Poor 12.8% |
| Immigrants | Western Asia | 14.1 /100 | #204 | Poor 12.9% |
| Tsimshian | 9.2 /100 | #205 | Tragic 13.0% |
| Immigrants | Eastern Africa | 7.0 /100 | #206 | Tragic 13.1% |
| Panamanians | 6.6 /100 | #207 | Tragic 13.1% |
| Ugandans | 6.2 /100 | #208 | Tragic 13.1% |
| Malaysians | 6.1 /100 | #209 | Tragic 13.1% |
| Immigrants | Azores | 6.1 /100 | #210 | Tragic 13.1% |
| Moroccans | 5.2 /100 | #211 | Tragic 13.2% |
| Immigrants | Immigrants | 4.3 /100 | #212 | Tragic 13.2% |
Demographics Similar to Whites/Caucasians by Poverty
In terms of poverty, the demographic groups most similar to Whites/Caucasians are Immigrants from Oceania (12.3%, a difference of 0.080%), Immigrants from Venezuela (12.2%, a difference of 0.11%), Immigrants from Chile (12.2%, a difference of 0.13%), Venezuelan (12.2%, a difference of 0.15%), and Immigrants from Albania (12.2%, a difference of 0.23%).
| Demographics | Rating | Rank | Poverty |
| Ethiopians | 59.1 /100 | #162 | Average 12.2% |
| Immigrants | Ethiopia | 58.6 /100 | #163 | Average 12.2% |
| Colombians | 57.8 /100 | #164 | Average 12.2% |
| Immigrants | Albania | 57.7 /100 | #165 | Average 12.2% |
| Venezuelans | 56.9 /100 | #166 | Average 12.2% |
| Immigrants | Chile | 56.7 /100 | #167 | Average 12.2% |
| Immigrants | Venezuela | 56.5 /100 | #168 | Average 12.2% |
| Whites/Caucasians | 55.4 /100 | #169 | Average 12.3% |
| Immigrants | Oceania | 54.6 /100 | #170 | Average 12.3% |
| Immigrants | Spain | 51.3 /100 | #171 | Average 12.3% |
| Immigrants | Portugal | 50.5 /100 | #172 | Average 12.3% |
| Celtics | 50.1 /100 | #173 | Average 12.3% |
| Lebanese | 50.0 /100 | #174 | Average 12.3% |
| South Americans | 48.7 /100 | #175 | Average 12.3% |
| Immigrants | Colombia | 47.7 /100 | #176 | Average 12.3% |