Uruguayan vs Immigrants from Sierra Leone Single Female Poverty
COMPARE
Uruguayan
Immigrants from Sierra Leone
Single Female Poverty
Single Female Poverty Comparison
Uruguayans
Immigrants from Sierra Leone
20.2%
SINGLE FEMALE POVERTY
92.1/ 100
METRIC RATING
132nd/ 347
METRIC RANK
19.4%
SINGLE FEMALE POVERTY
99.3/ 100
METRIC RATING
79th/ 347
METRIC RANK
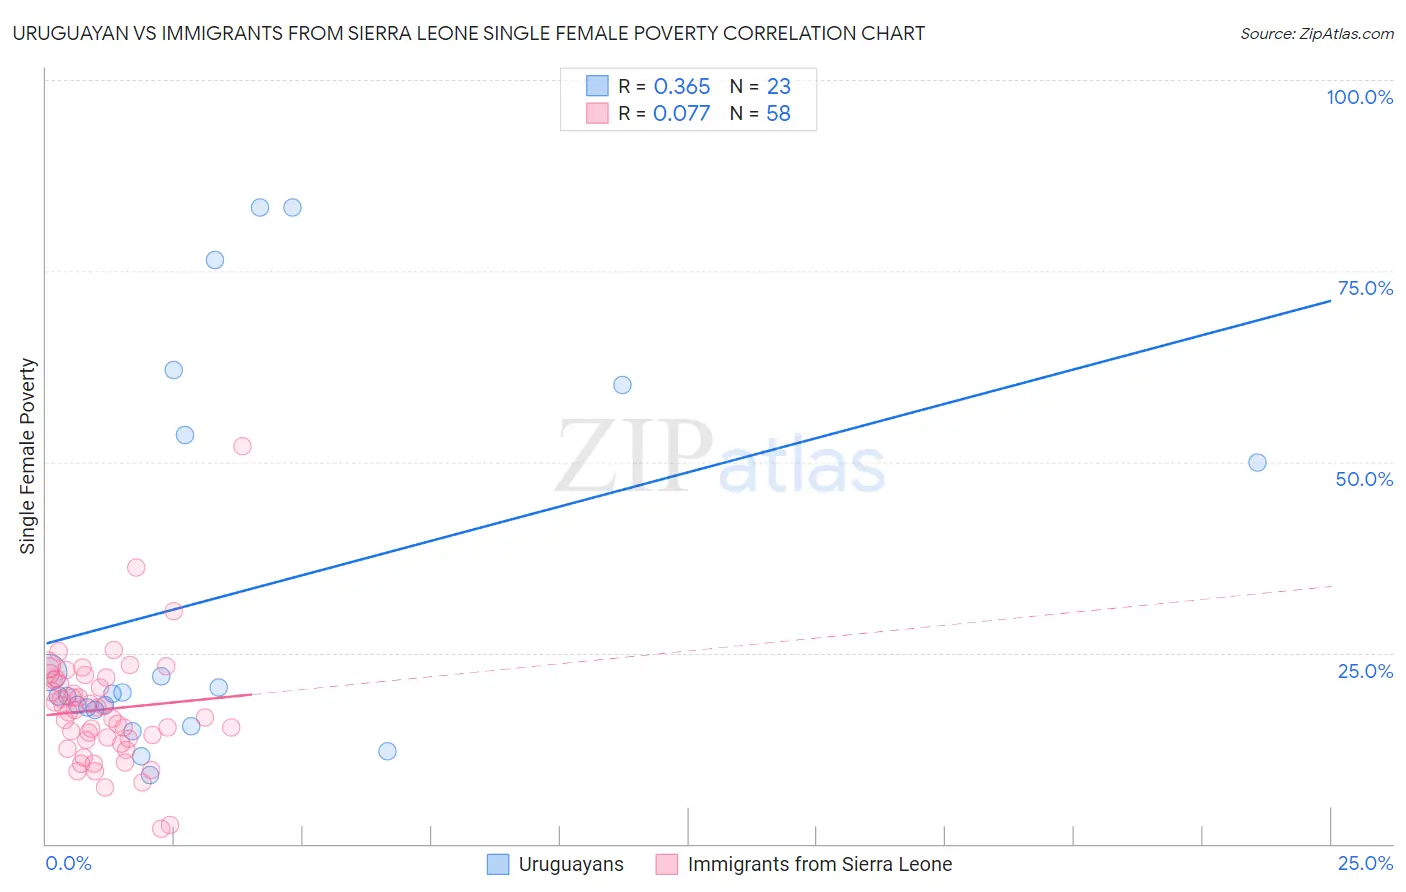
Uruguayan vs Immigrants from Sierra Leone Single Female Poverty Correlation Chart
The statistical analysis conducted on geographies consisting of 143,837,387 people shows a mild positive correlation between the proportion of Uruguayans and poverty level among single females in the United States with a correlation coefficient (R) of 0.365 and weighted average of 20.2%. Similarly, the statistical analysis conducted on geographies consisting of 101,303,700 people shows a slight positive correlation between the proportion of Immigrants from Sierra Leone and poverty level among single females in the United States with a correlation coefficient (R) of 0.077 and weighted average of 19.4%, a difference of 4.1%.
Single Female Poverty Correlation Summary
| Measurement | Uruguayan | Immigrants from Sierra Leone |
| Minimum | 9.0% | 1.9% |
| Maximum | 83.3% | 52.1% |
| Range | 74.3% | 50.2% |
| Mean | 32.4% | 17.6% |
| Median | 19.7% | 17.4% |
| Interquartile 25% (IQ1) | 17.5% | 13.6% |
| Interquartile 75% (IQ3) | 53.6% | 21.7% |
| Interquartile Range (IQR) | 36.1% | 8.1% |
| Standard Deviation (Sample) | 24.7% | 7.7% |
| Standard Deviation (Population) | 24.1% | 7.6% |
Similar Demographics by Single Female Poverty
Demographics Similar to Uruguayans by Single Female Poverty
In terms of single female poverty, the demographic groups most similar to Uruguayans are Pakistani (20.2%, a difference of 0.0%), Immigrants from England (20.2%, a difference of 0.030%), Immigrants from Hungary (20.2%, a difference of 0.050%), Immigrants from Morocco (20.2%, a difference of 0.080%), and Immigrants from Venezuela (20.2%, a difference of 0.12%).
| Demographics | Rating | Rank | Single Female Poverty |
| Immigrants | South Africa | 93.9 /100 | #125 | Exceptional 20.1% |
| Serbians | 93.3 /100 | #126 | Exceptional 20.1% |
| Mongolians | 93.2 /100 | #127 | Exceptional 20.2% |
| Immigrants | Spain | 92.7 /100 | #128 | Exceptional 20.2% |
| Immigrants | Morocco | 92.4 /100 | #129 | Exceptional 20.2% |
| Immigrants | Hungary | 92.3 /100 | #130 | Exceptional 20.2% |
| Pakistanis | 92.1 /100 | #131 | Exceptional 20.2% |
| Uruguayans | 92.1 /100 | #132 | Exceptional 20.2% |
| Immigrants | England | 91.9 /100 | #133 | Exceptional 20.2% |
| Immigrants | Venezuela | 91.5 /100 | #134 | Exceptional 20.2% |
| Immigrants | Iraq | 91.2 /100 | #135 | Exceptional 20.2% |
| Immigrants | Canada | 91.2 /100 | #136 | Exceptional 20.2% |
| Immigrants | Nepal | 90.6 /100 | #137 | Exceptional 20.3% |
| Slovenes | 90.5 /100 | #138 | Exceptional 20.3% |
| Immigrants | Kuwait | 90.4 /100 | #139 | Exceptional 20.3% |
Demographics Similar to Immigrants from Sierra Leone by Single Female Poverty
In terms of single female poverty, the demographic groups most similar to Immigrants from Sierra Leone are Albanian (19.4%, a difference of 0.020%), Immigrants from Australia (19.4%, a difference of 0.040%), Immigrants from Scotland (19.4%, a difference of 0.060%), Immigrants from Malaysia (19.4%, a difference of 0.070%), and Taiwanese (19.4%, a difference of 0.080%).
| Demographics | Rating | Rank | Single Female Poverty |
| Immigrants | Latvia | 99.4 /100 | #72 | Exceptional 19.3% |
| Immigrants | Peru | 99.4 /100 | #73 | Exceptional 19.3% |
| Immigrants | Belarus | 99.4 /100 | #74 | Exceptional 19.3% |
| Immigrants | Turkey | 99.4 /100 | #75 | Exceptional 19.4% |
| Peruvians | 99.4 /100 | #76 | Exceptional 19.4% |
| Immigrants | Russia | 99.3 /100 | #77 | Exceptional 19.4% |
| Albanians | 99.3 /100 | #78 | Exceptional 19.4% |
| Immigrants | Sierra Leone | 99.3 /100 | #79 | Exceptional 19.4% |
| Immigrants | Australia | 99.3 /100 | #80 | Exceptional 19.4% |
| Immigrants | Scotland | 99.2 /100 | #81 | Exceptional 19.4% |
| Immigrants | Malaysia | 99.2 /100 | #82 | Exceptional 19.4% |
| Taiwanese | 99.2 /100 | #83 | Exceptional 19.4% |
| Immigrants | Sweden | 99.2 /100 | #84 | Exceptional 19.4% |
| Immigrants | Albania | 99.2 /100 | #85 | Exceptional 19.4% |
| Greeks | 99.2 /100 | #86 | Exceptional 19.4% |