Immigrants from Thailand vs Immigrants from Sierra Leone Single Female Poverty
COMPARE
Immigrants from Thailand
Immigrants from Sierra Leone
Single Female Poverty
Single Female Poverty Comparison
Immigrants from Thailand
Immigrants from Sierra Leone
22.0%
SINGLE FEMALE POVERTY
5.0/ 100
METRIC RATING
232nd/ 347
METRIC RANK
19.4%
SINGLE FEMALE POVERTY
99.3/ 100
METRIC RATING
79th/ 347
METRIC RANK
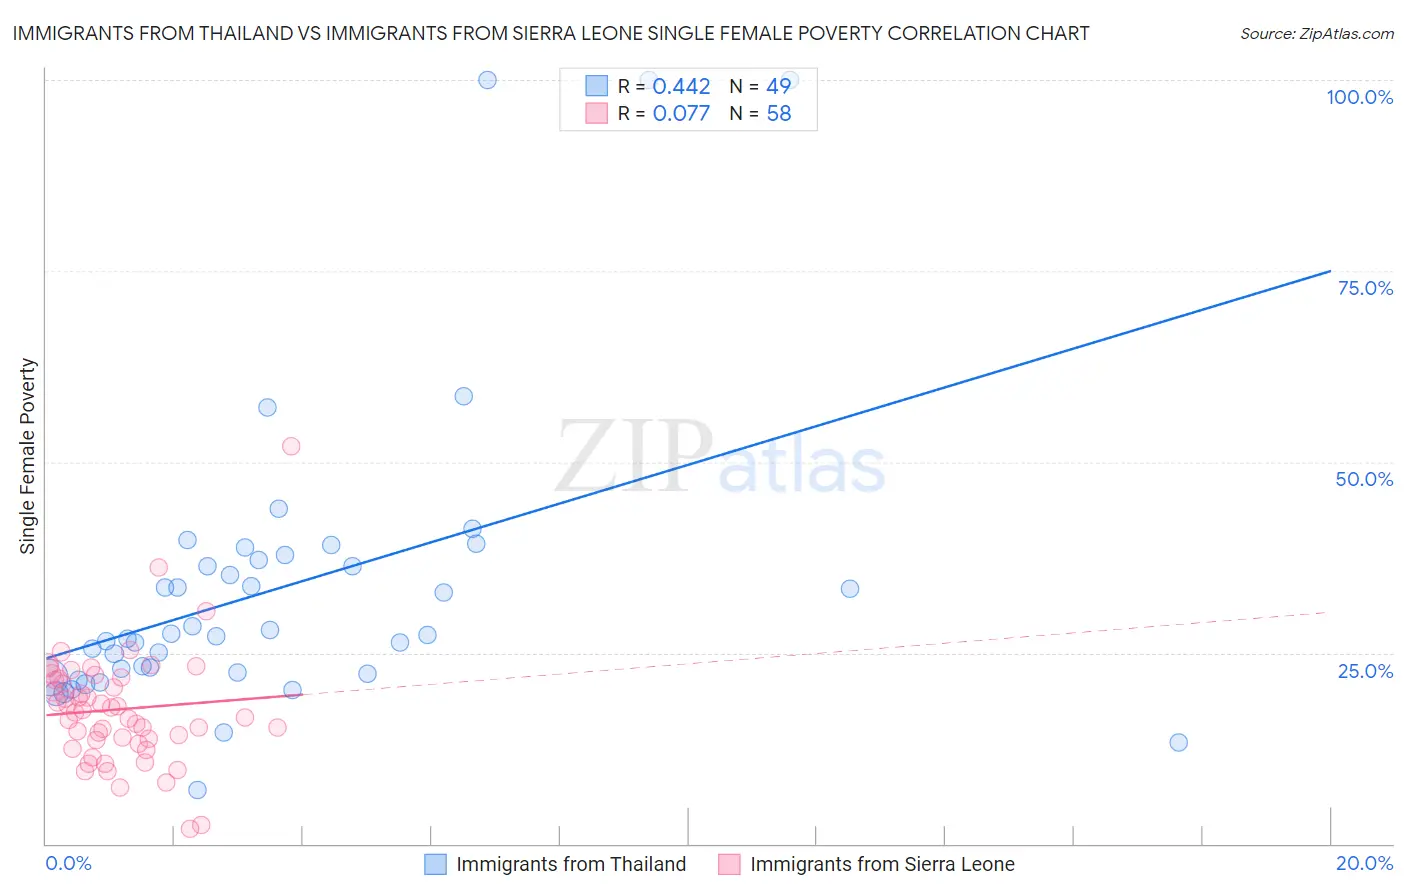
Immigrants from Thailand vs Immigrants from Sierra Leone Single Female Poverty Correlation Chart
The statistical analysis conducted on geographies consisting of 313,832,710 people shows a moderate positive correlation between the proportion of Immigrants from Thailand and poverty level among single females in the United States with a correlation coefficient (R) of 0.442 and weighted average of 22.0%. Similarly, the statistical analysis conducted on geographies consisting of 101,303,700 people shows a slight positive correlation between the proportion of Immigrants from Sierra Leone and poverty level among single females in the United States with a correlation coefficient (R) of 0.077 and weighted average of 19.4%, a difference of 13.2%.
Single Female Poverty Correlation Summary
| Measurement | Immigrants from Thailand | Immigrants from Sierra Leone |
| Minimum | 7.0% | 1.9% |
| Maximum | 100.0% | 52.1% |
| Range | 93.0% | 50.2% |
| Mean | 33.5% | 17.6% |
| Median | 27.4% | 17.4% |
| Interquartile 25% (IQ1) | 22.3% | 13.6% |
| Interquartile 75% (IQ3) | 37.4% | 21.7% |
| Interquartile Range (IQR) | 15.1% | 8.1% |
| Standard Deviation (Sample) | 19.8% | 7.7% |
| Standard Deviation (Population) | 19.6% | 7.6% |
Similar Demographics by Single Female Poverty
Demographics Similar to Immigrants from Thailand by Single Female Poverty
In terms of single female poverty, the demographic groups most similar to Immigrants from Thailand are Welsh (22.0%, a difference of 0.010%), Spaniard (22.0%, a difference of 0.090%), Immigrants from Western Africa (22.0%, a difference of 0.10%), Spanish (22.0%, a difference of 0.10%), and Tlingit-Haida (21.9%, a difference of 0.12%).
| Demographics | Rating | Rank | Single Female Poverty |
| English | 6.4 /100 | #225 | Tragic 21.9% |
| Immigrants | Portugal | 5.8 /100 | #226 | Tragic 21.9% |
| Immigrants | Ghana | 5.8 /100 | #227 | Tragic 21.9% |
| Salvadorans | 5.5 /100 | #228 | Tragic 21.9% |
| Tlingit-Haida | 5.4 /100 | #229 | Tragic 21.9% |
| Immigrants | Western Africa | 5.3 /100 | #230 | Tragic 22.0% |
| Welsh | 5.0 /100 | #231 | Tragic 22.0% |
| Immigrants | Thailand | 5.0 /100 | #232 | Tragic 22.0% |
| Spaniards | 4.7 /100 | #233 | Tragic 22.0% |
| Spanish | 4.7 /100 | #234 | Tragic 22.0% |
| Dutch | 4.6 /100 | #235 | Tragic 22.0% |
| Immigrants | Ecuador | 4.2 /100 | #236 | Tragic 22.0% |
| Vietnamese | 4.0 /100 | #237 | Tragic 22.0% |
| French Canadians | 2.8 /100 | #238 | Tragic 22.2% |
| Malaysians | 2.8 /100 | #239 | Tragic 22.2% |
Demographics Similar to Immigrants from Sierra Leone by Single Female Poverty
In terms of single female poverty, the demographic groups most similar to Immigrants from Sierra Leone are Albanian (19.4%, a difference of 0.020%), Immigrants from Australia (19.4%, a difference of 0.040%), Immigrants from Scotland (19.4%, a difference of 0.060%), Immigrants from Malaysia (19.4%, a difference of 0.070%), and Taiwanese (19.4%, a difference of 0.080%).
| Demographics | Rating | Rank | Single Female Poverty |
| Immigrants | Latvia | 99.4 /100 | #72 | Exceptional 19.3% |
| Immigrants | Peru | 99.4 /100 | #73 | Exceptional 19.3% |
| Immigrants | Belarus | 99.4 /100 | #74 | Exceptional 19.3% |
| Immigrants | Turkey | 99.4 /100 | #75 | Exceptional 19.4% |
| Peruvians | 99.4 /100 | #76 | Exceptional 19.4% |
| Immigrants | Russia | 99.3 /100 | #77 | Exceptional 19.4% |
| Albanians | 99.3 /100 | #78 | Exceptional 19.4% |
| Immigrants | Sierra Leone | 99.3 /100 | #79 | Exceptional 19.4% |
| Immigrants | Australia | 99.3 /100 | #80 | Exceptional 19.4% |
| Immigrants | Scotland | 99.2 /100 | #81 | Exceptional 19.4% |
| Immigrants | Malaysia | 99.2 /100 | #82 | Exceptional 19.4% |
| Taiwanese | 99.2 /100 | #83 | Exceptional 19.4% |
| Immigrants | Sweden | 99.2 /100 | #84 | Exceptional 19.4% |
| Immigrants | Albania | 99.2 /100 | #85 | Exceptional 19.4% |
| Greeks | 99.2 /100 | #86 | Exceptional 19.4% |