Iroquois vs Immigrants from Sierra Leone Single Female Poverty
COMPARE
Iroquois
Immigrants from Sierra Leone
Single Female Poverty
Single Female Poverty Comparison
Iroquois
Immigrants from Sierra Leone
25.7%
SINGLE FEMALE POVERTY
0.0/ 100
METRIC RATING
315th/ 347
METRIC RANK
19.4%
SINGLE FEMALE POVERTY
99.3/ 100
METRIC RATING
79th/ 347
METRIC RANK
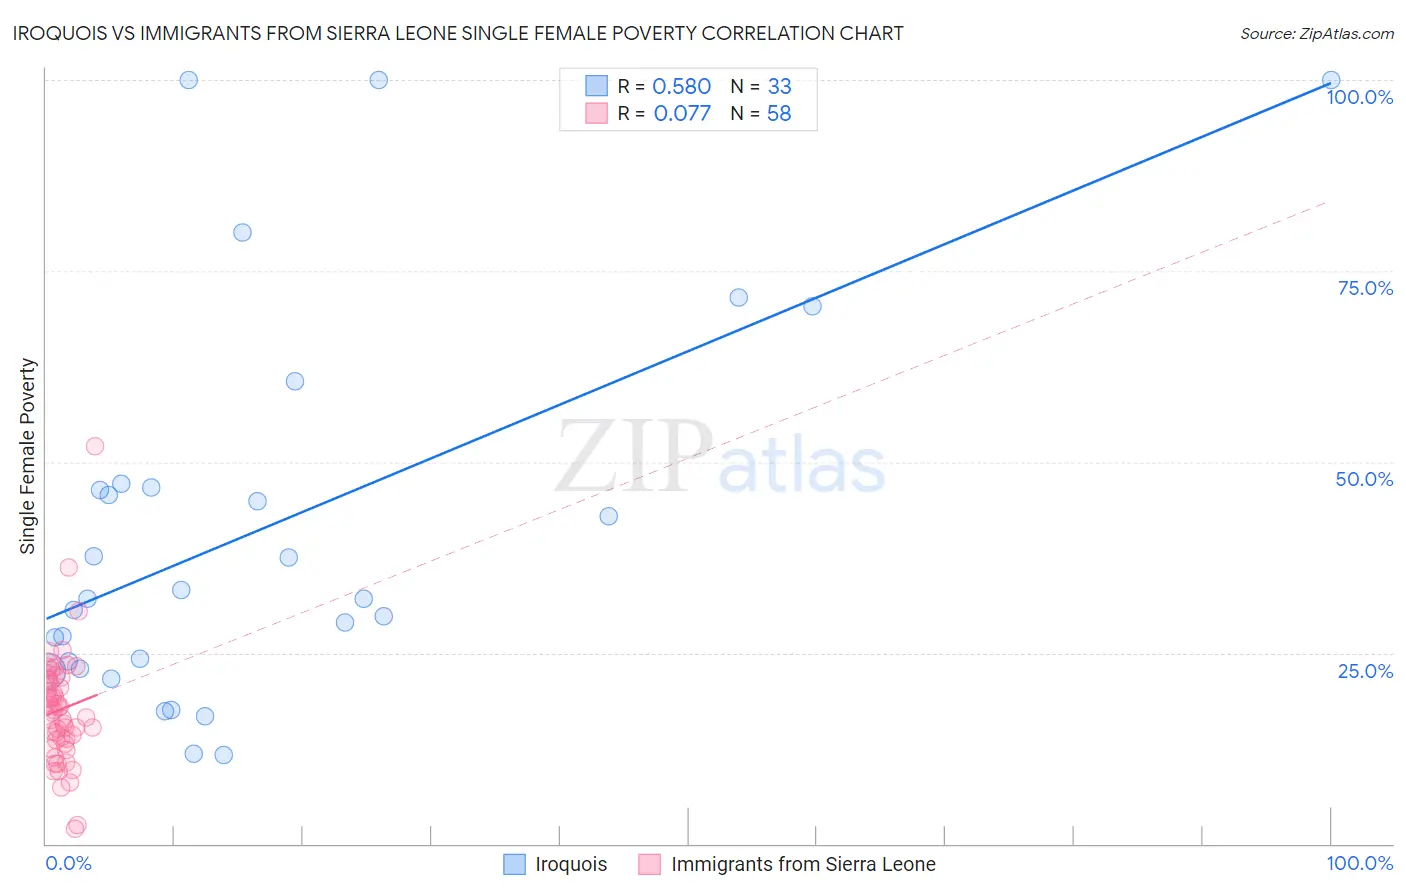
Iroquois vs Immigrants from Sierra Leone Single Female Poverty Correlation Chart
The statistical analysis conducted on geographies consisting of 205,850,666 people shows a substantial positive correlation between the proportion of Iroquois and poverty level among single females in the United States with a correlation coefficient (R) of 0.580 and weighted average of 25.7%. Similarly, the statistical analysis conducted on geographies consisting of 101,303,700 people shows a slight positive correlation between the proportion of Immigrants from Sierra Leone and poverty level among single females in the United States with a correlation coefficient (R) of 0.077 and weighted average of 19.4%, a difference of 32.7%.
Single Female Poverty Correlation Summary
| Measurement | Iroquois | Immigrants from Sierra Leone |
| Minimum | 11.7% | 1.9% |
| Maximum | 100.0% | 52.1% |
| Range | 88.3% | 50.2% |
| Mean | 41.3% | 17.6% |
| Median | 32.1% | 17.4% |
| Interquartile 25% (IQ1) | 23.3% | 13.6% |
| Interquartile 75% (IQ3) | 46.9% | 21.7% |
| Interquartile Range (IQR) | 23.6% | 8.1% |
| Standard Deviation (Sample) | 25.2% | 7.7% |
| Standard Deviation (Population) | 24.8% | 7.6% |
Similar Demographics by Single Female Poverty
Demographics Similar to Iroquois by Single Female Poverty
In terms of single female poverty, the demographic groups most similar to Iroquois are Immigrants from Somalia (25.8%, a difference of 0.15%), Cherokee (25.7%, a difference of 0.32%), Comanche (25.6%, a difference of 0.68%), Paiute (25.5%, a difference of 0.79%), and Immigrants from Honduras (25.5%, a difference of 0.84%).
| Demographics | Rating | Rank | Single Female Poverty |
| Aleuts | 0.0 /100 | #308 | Tragic 25.4% |
| Dominicans | 0.0 /100 | #309 | Tragic 25.4% |
| Central American Indians | 0.0 /100 | #310 | Tragic 25.5% |
| Immigrants | Honduras | 0.0 /100 | #311 | Tragic 25.5% |
| Paiute | 0.0 /100 | #312 | Tragic 25.5% |
| Comanche | 0.0 /100 | #313 | Tragic 25.6% |
| Cherokee | 0.0 /100 | #314 | Tragic 25.7% |
| Iroquois | 0.0 /100 | #315 | Tragic 25.7% |
| Immigrants | Somalia | 0.0 /100 | #316 | Tragic 25.8% |
| Ottawa | 0.0 /100 | #317 | Tragic 26.0% |
| Chickasaw | 0.0 /100 | #318 | Tragic 26.3% |
| Blacks/African Americans | 0.0 /100 | #319 | Tragic 26.4% |
| Arapaho | 0.0 /100 | #320 | Tragic 26.4% |
| Yup'ik | 0.0 /100 | #321 | Tragic 26.6% |
| Seminole | 0.0 /100 | #322 | Tragic 26.8% |
Demographics Similar to Immigrants from Sierra Leone by Single Female Poverty
In terms of single female poverty, the demographic groups most similar to Immigrants from Sierra Leone are Albanian (19.4%, a difference of 0.020%), Immigrants from Australia (19.4%, a difference of 0.040%), Immigrants from Scotland (19.4%, a difference of 0.060%), Immigrants from Malaysia (19.4%, a difference of 0.070%), and Taiwanese (19.4%, a difference of 0.080%).
| Demographics | Rating | Rank | Single Female Poverty |
| Immigrants | Latvia | 99.4 /100 | #72 | Exceptional 19.3% |
| Immigrants | Peru | 99.4 /100 | #73 | Exceptional 19.3% |
| Immigrants | Belarus | 99.4 /100 | #74 | Exceptional 19.3% |
| Immigrants | Turkey | 99.4 /100 | #75 | Exceptional 19.4% |
| Peruvians | 99.4 /100 | #76 | Exceptional 19.4% |
| Immigrants | Russia | 99.3 /100 | #77 | Exceptional 19.4% |
| Albanians | 99.3 /100 | #78 | Exceptional 19.4% |
| Immigrants | Sierra Leone | 99.3 /100 | #79 | Exceptional 19.4% |
| Immigrants | Australia | 99.3 /100 | #80 | Exceptional 19.4% |
| Immigrants | Scotland | 99.2 /100 | #81 | Exceptional 19.4% |
| Immigrants | Malaysia | 99.2 /100 | #82 | Exceptional 19.4% |
| Taiwanese | 99.2 /100 | #83 | Exceptional 19.4% |
| Immigrants | Sweden | 99.2 /100 | #84 | Exceptional 19.4% |
| Immigrants | Albania | 99.2 /100 | #85 | Exceptional 19.4% |
| Greeks | 99.2 /100 | #86 | Exceptional 19.4% |