Dominican vs Immigrants from Sierra Leone Single Female Poverty
COMPARE
Dominican
Immigrants from Sierra Leone
Single Female Poverty
Single Female Poverty Comparison
Dominicans
Immigrants from Sierra Leone
25.4%
SINGLE FEMALE POVERTY
0.0/ 100
METRIC RATING
309th/ 347
METRIC RANK
19.4%
SINGLE FEMALE POVERTY
99.3/ 100
METRIC RATING
79th/ 347
METRIC RANK
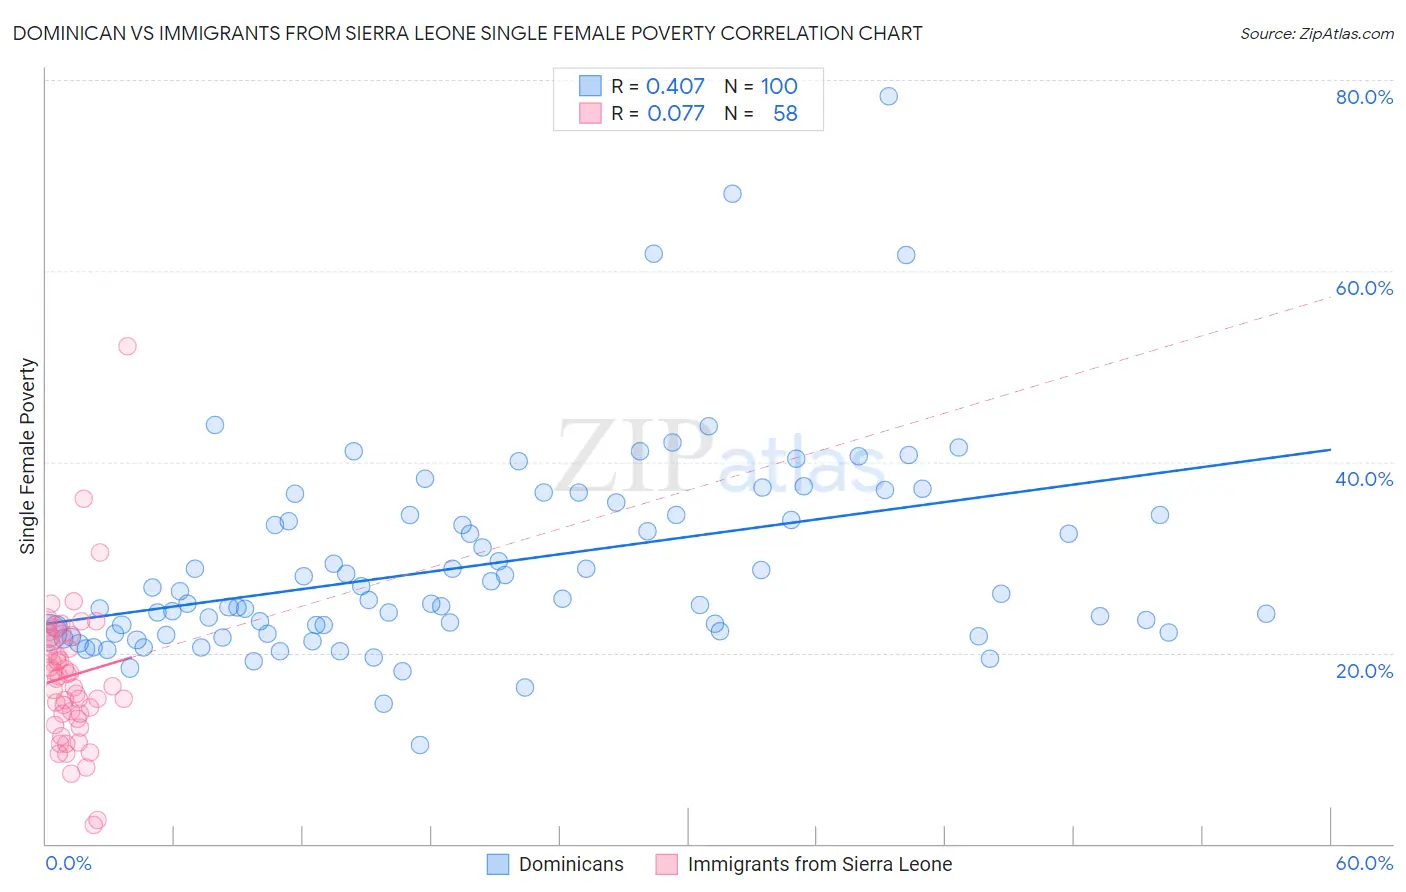
Dominican vs Immigrants from Sierra Leone Single Female Poverty Correlation Chart
The statistical analysis conducted on geographies consisting of 349,852,578 people shows a moderate positive correlation between the proportion of Dominicans and poverty level among single females in the United States with a correlation coefficient (R) of 0.407 and weighted average of 25.4%. Similarly, the statistical analysis conducted on geographies consisting of 101,303,700 people shows a slight positive correlation between the proportion of Immigrants from Sierra Leone and poverty level among single females in the United States with a correlation coefficient (R) of 0.077 and weighted average of 19.4%, a difference of 31.0%.
Single Female Poverty Correlation Summary
| Measurement | Dominican | Immigrants from Sierra Leone |
| Minimum | 10.3% | 1.9% |
| Maximum | 78.2% | 52.1% |
| Range | 67.9% | 50.2% |
| Mean | 29.2% | 17.6% |
| Median | 25.3% | 17.4% |
| Interquartile 25% (IQ1) | 22.1% | 13.6% |
| Interquartile 75% (IQ3) | 34.4% | 21.7% |
| Interquartile Range (IQR) | 12.4% | 8.1% |
| Standard Deviation (Sample) | 10.8% | 7.7% |
| Standard Deviation (Population) | 10.7% | 7.6% |
Similar Demographics by Single Female Poverty
Demographics Similar to Dominicans by Single Female Poverty
In terms of single female poverty, the demographic groups most similar to Dominicans are Aleut (25.4%, a difference of 0.010%), Central American Indian (25.5%, a difference of 0.15%), Potawatomi (25.4%, a difference of 0.18%), Immigrants from Mexico (25.3%, a difference of 0.41%), and Immigrants from Honduras (25.5%, a difference of 0.43%).
| Demographics | Rating | Rank | Single Female Poverty |
| Shoshone | 0.0 /100 | #302 | Tragic 25.1% |
| Somalis | 0.0 /100 | #303 | Tragic 25.2% |
| Immigrants | Congo | 0.0 /100 | #304 | Tragic 25.3% |
| Immigrants | Dominican Republic | 0.0 /100 | #305 | Tragic 25.3% |
| Immigrants | Mexico | 0.0 /100 | #306 | Tragic 25.3% |
| Potawatomi | 0.0 /100 | #307 | Tragic 25.4% |
| Aleuts | 0.0 /100 | #308 | Tragic 25.4% |
| Dominicans | 0.0 /100 | #309 | Tragic 25.4% |
| Central American Indians | 0.0 /100 | #310 | Tragic 25.5% |
| Immigrants | Honduras | 0.0 /100 | #311 | Tragic 25.5% |
| Paiute | 0.0 /100 | #312 | Tragic 25.5% |
| Comanche | 0.0 /100 | #313 | Tragic 25.6% |
| Cherokee | 0.0 /100 | #314 | Tragic 25.7% |
| Iroquois | 0.0 /100 | #315 | Tragic 25.7% |
| Immigrants | Somalia | 0.0 /100 | #316 | Tragic 25.8% |
Demographics Similar to Immigrants from Sierra Leone by Single Female Poverty
In terms of single female poverty, the demographic groups most similar to Immigrants from Sierra Leone are Albanian (19.4%, a difference of 0.020%), Immigrants from Australia (19.4%, a difference of 0.040%), Immigrants from Scotland (19.4%, a difference of 0.060%), Immigrants from Malaysia (19.4%, a difference of 0.070%), and Taiwanese (19.4%, a difference of 0.080%).
| Demographics | Rating | Rank | Single Female Poverty |
| Immigrants | Latvia | 99.4 /100 | #72 | Exceptional 19.3% |
| Immigrants | Peru | 99.4 /100 | #73 | Exceptional 19.3% |
| Immigrants | Belarus | 99.4 /100 | #74 | Exceptional 19.3% |
| Immigrants | Turkey | 99.4 /100 | #75 | Exceptional 19.4% |
| Peruvians | 99.4 /100 | #76 | Exceptional 19.4% |
| Immigrants | Russia | 99.3 /100 | #77 | Exceptional 19.4% |
| Albanians | 99.3 /100 | #78 | Exceptional 19.4% |
| Immigrants | Sierra Leone | 99.3 /100 | #79 | Exceptional 19.4% |
| Immigrants | Australia | 99.3 /100 | #80 | Exceptional 19.4% |
| Immigrants | Scotland | 99.2 /100 | #81 | Exceptional 19.4% |
| Immigrants | Malaysia | 99.2 /100 | #82 | Exceptional 19.4% |
| Taiwanese | 99.2 /100 | #83 | Exceptional 19.4% |
| Immigrants | Sweden | 99.2 /100 | #84 | Exceptional 19.4% |
| Immigrants | Albania | 99.2 /100 | #85 | Exceptional 19.4% |
| Greeks | 99.2 /100 | #86 | Exceptional 19.4% |