Slovene vs Mexican American Indian Married-Couple Family Poverty
COMPARE
Slovene
Mexican American Indian
Married-Couple Family Poverty
Married-Couple Family Poverty Comparison
Slovenes
Mexican American Indians
3.8%
MARRIED-COUPLE FAMILY POVERTY
100.0/ 100
METRIC RATING
4th/ 347
METRIC RANK
6.4%
MARRIED-COUPLE FAMILY POVERTY
0.0/ 100
METRIC RATING
281st/ 347
METRIC RANK
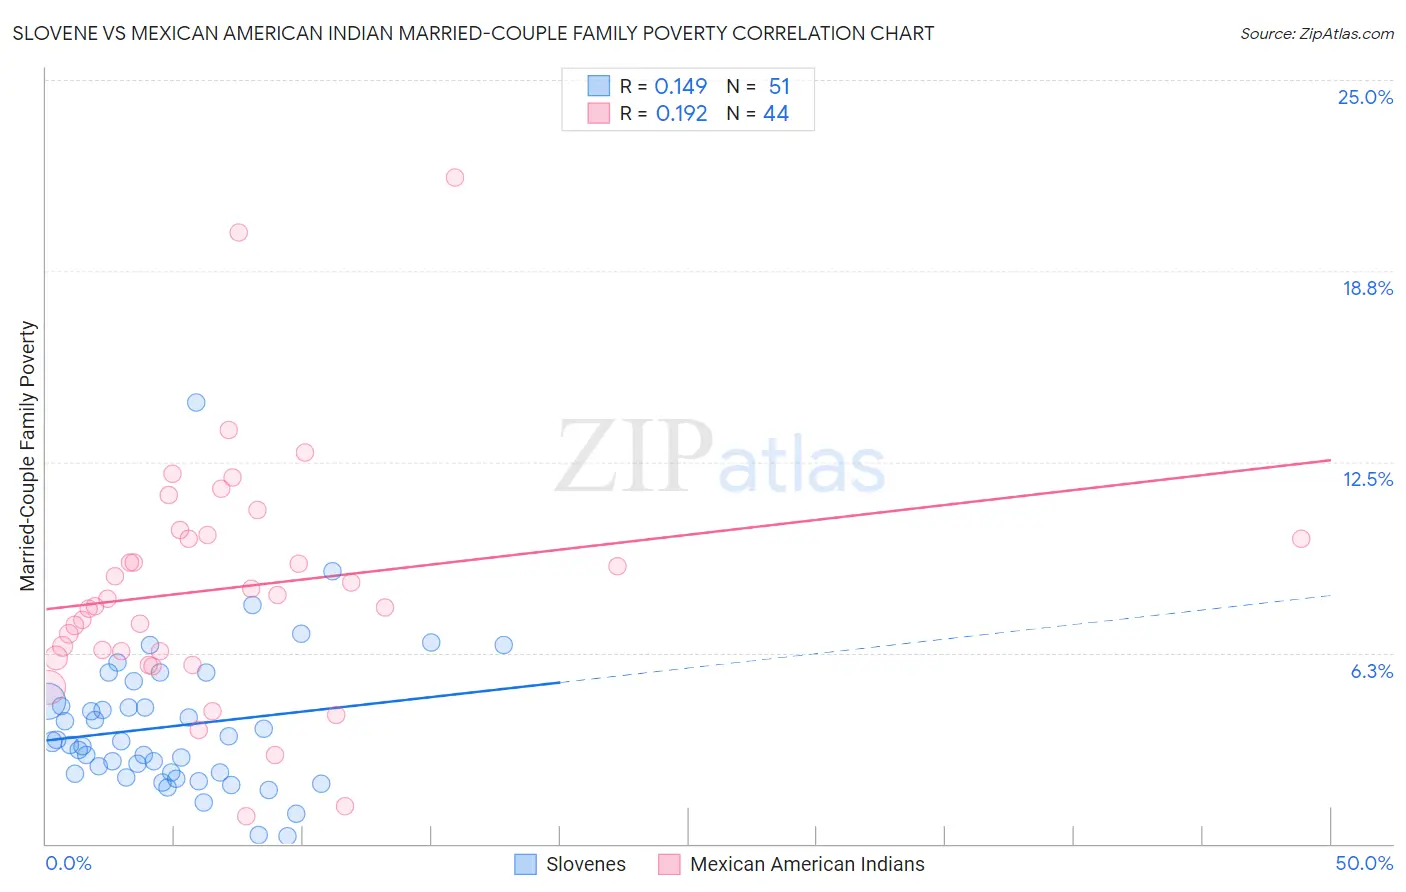
Slovene vs Mexican American Indian Married-Couple Family Poverty Correlation Chart
The statistical analysis conducted on geographies consisting of 259,368,188 people shows a poor positive correlation between the proportion of Slovenes and poverty level among married-couple families in the United States with a correlation coefficient (R) of 0.149 and weighted average of 3.8%. Similarly, the statistical analysis conducted on geographies consisting of 316,454,269 people shows a poor positive correlation between the proportion of Mexican American Indians and poverty level among married-couple families in the United States with a correlation coefficient (R) of 0.192 and weighted average of 6.4%, a difference of 66.6%.
Married-Couple Family Poverty Correlation Summary
| Measurement | Slovene | Mexican American Indian |
| Minimum | 0.24% | 0.88% |
| Maximum | 14.4% | 21.8% |
| Range | 14.2% | 20.9% |
| Mean | 3.8% | 8.4% |
| Median | 3.3% | 7.9% |
| Interquartile 25% (IQ1) | 2.3% | 6.2% |
| Interquartile 75% (IQ3) | 4.7% | 10.0% |
| Interquartile Range (IQR) | 2.4% | 3.9% |
| Standard Deviation (Sample) | 2.4% | 4.0% |
| Standard Deviation (Population) | 2.4% | 3.9% |
Similar Demographics by Married-Couple Family Poverty
Demographics Similar to Slovenes by Married-Couple Family Poverty
In terms of married-couple family poverty, the demographic groups most similar to Slovenes are Swedish (3.9%, a difference of 0.15%), Luxembourger (3.9%, a difference of 0.76%), Latvian (3.9%, a difference of 1.3%), Thai (3.9%, a difference of 1.8%), and Croatian (3.9%, a difference of 2.3%).
| Demographics | Rating | Rank | Married-Couple Family Poverty |
| Immigrants | India | 100.0 /100 | #1 | Exceptional 3.6% |
| Chinese | 100.0 /100 | #2 | Exceptional 3.6% |
| Norwegians | 100.0 /100 | #3 | Exceptional 3.7% |
| Slovenes | 100.0 /100 | #4 | Exceptional 3.8% |
| Swedes | 100.0 /100 | #5 | Exceptional 3.9% |
| Luxembourgers | 100.0 /100 | #6 | Exceptional 3.9% |
| Latvians | 100.0 /100 | #7 | Exceptional 3.9% |
| Thais | 100.0 /100 | #8 | Exceptional 3.9% |
| Croatians | 100.0 /100 | #9 | Exceptional 3.9% |
| Carpatho Rusyns | 100.0 /100 | #10 | Exceptional 3.9% |
| Lithuanians | 100.0 /100 | #11 | Exceptional 4.0% |
| Bulgarians | 100.0 /100 | #12 | Exceptional 4.0% |
| Czechs | 100.0 /100 | #13 | Exceptional 4.0% |
| Slovaks | 100.0 /100 | #14 | Exceptional 4.0% |
| Poles | 100.0 /100 | #15 | Exceptional 4.0% |
Demographics Similar to Mexican American Indians by Married-Couple Family Poverty
In terms of married-couple family poverty, the demographic groups most similar to Mexican American Indians are Seminole (6.4%, a difference of 0.0%), Ute (6.4%, a difference of 0.39%), Dutch West Indian (6.4%, a difference of 0.50%), West Indian (6.4%, a difference of 0.51%), and Houma (6.4%, a difference of 0.56%).
| Demographics | Rating | Rank | Married-Couple Family Poverty |
| Barbadians | 0.1 /100 | #274 | Tragic 6.3% |
| Choctaw | 0.1 /100 | #275 | Tragic 6.3% |
| Yaqui | 0.1 /100 | #276 | Tragic 6.3% |
| Indonesians | 0.1 /100 | #277 | Tragic 6.3% |
| Immigrants | Trinidad and Tobago | 0.1 /100 | #278 | Tragic 6.4% |
| Houma | 0.0 /100 | #279 | Tragic 6.4% |
| West Indians | 0.0 /100 | #280 | Tragic 6.4% |
| Mexican American Indians | 0.0 /100 | #281 | Tragic 6.4% |
| Seminole | 0.0 /100 | #282 | Tragic 6.4% |
| Ute | 0.0 /100 | #283 | Tragic 6.4% |
| Dutch West Indians | 0.0 /100 | #284 | Tragic 6.4% |
| Blacks/African Americans | 0.0 /100 | #285 | Tragic 6.5% |
| Guyanese | 0.0 /100 | #286 | Tragic 6.5% |
| Ecuadorians | 0.0 /100 | #287 | Tragic 6.5% |
| Salvadorans | 0.0 /100 | #288 | Tragic 6.5% |