Slovene vs Immigrants from Haiti Married-Couple Family Poverty
COMPARE
Slovene
Immigrants from Haiti
Married-Couple Family Poverty
Married-Couple Family Poverty Comparison
Slovenes
Immigrants from Haiti
3.8%
MARRIED-COUPLE FAMILY POVERTY
100.0/ 100
METRIC RATING
4th/ 347
METRIC RANK
7.0%
MARRIED-COUPLE FAMILY POVERTY
0.0/ 100
METRIC RATING
306th/ 347
METRIC RANK
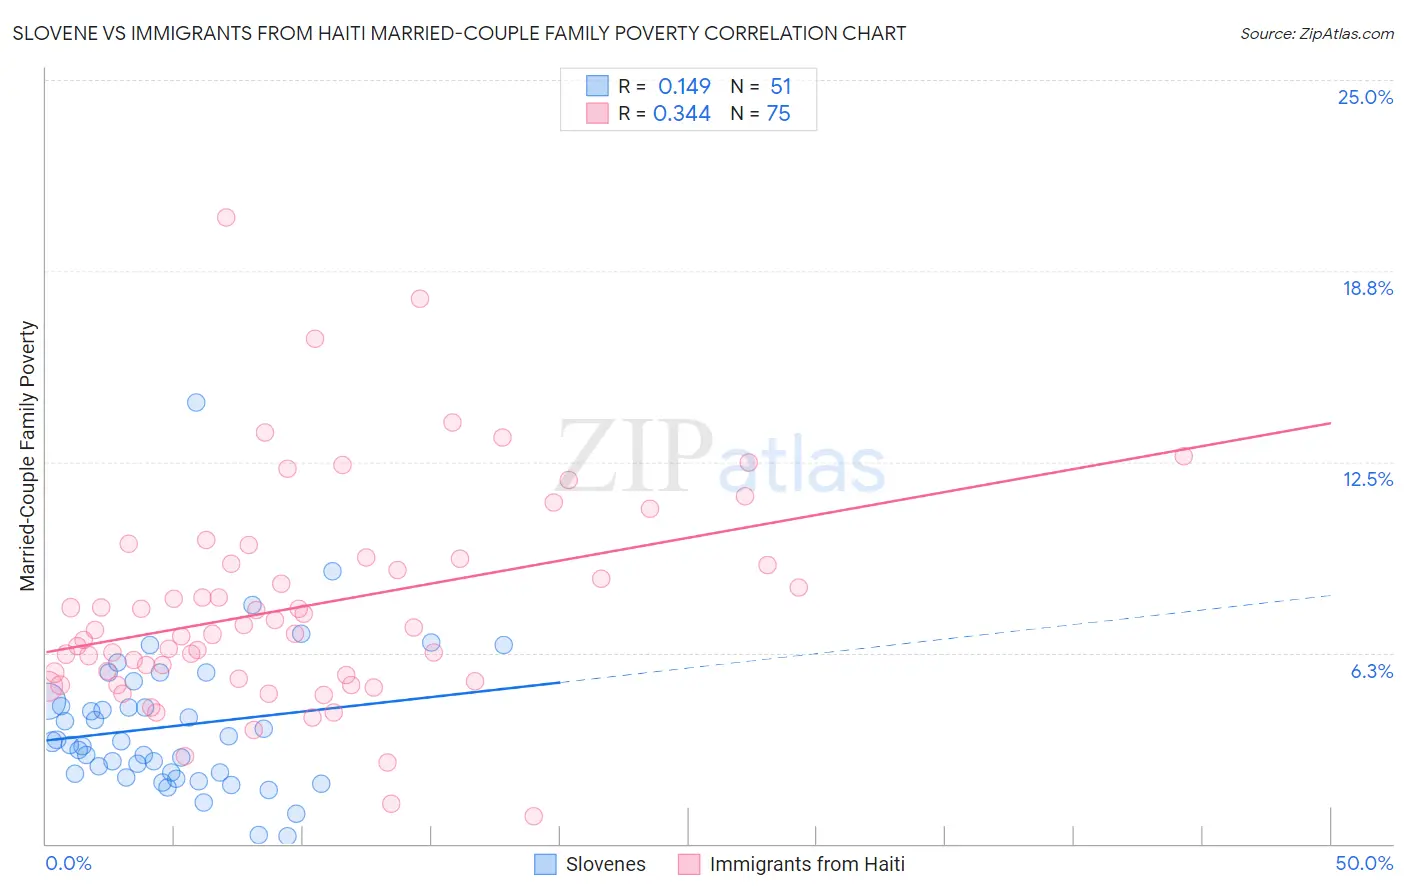
Slovene vs Immigrants from Haiti Married-Couple Family Poverty Correlation Chart
The statistical analysis conducted on geographies consisting of 259,368,188 people shows a poor positive correlation between the proportion of Slovenes and poverty level among married-couple families in the United States with a correlation coefficient (R) of 0.149 and weighted average of 3.8%. Similarly, the statistical analysis conducted on geographies consisting of 224,016,924 people shows a mild positive correlation between the proportion of Immigrants from Haiti and poverty level among married-couple families in the United States with a correlation coefficient (R) of 0.344 and weighted average of 7.0%, a difference of 80.8%.
Married-Couple Family Poverty Correlation Summary
| Measurement | Slovene | Immigrants from Haiti |
| Minimum | 0.24% | 0.90% |
| Maximum | 14.4% | 20.5% |
| Range | 14.2% | 19.6% |
| Mean | 3.8% | 7.8% |
| Median | 3.3% | 7.0% |
| Interquartile 25% (IQ1) | 2.3% | 5.4% |
| Interquartile 75% (IQ3) | 4.7% | 9.3% |
| Interquartile Range (IQR) | 2.4% | 4.0% |
| Standard Deviation (Sample) | 2.4% | 3.5% |
| Standard Deviation (Population) | 2.4% | 3.5% |
Similar Demographics by Married-Couple Family Poverty
Demographics Similar to Slovenes by Married-Couple Family Poverty
In terms of married-couple family poverty, the demographic groups most similar to Slovenes are Swedish (3.9%, a difference of 0.15%), Luxembourger (3.9%, a difference of 0.76%), Latvian (3.9%, a difference of 1.3%), Thai (3.9%, a difference of 1.8%), and Croatian (3.9%, a difference of 2.3%).
| Demographics | Rating | Rank | Married-Couple Family Poverty |
| Immigrants | India | 100.0 /100 | #1 | Exceptional 3.6% |
| Chinese | 100.0 /100 | #2 | Exceptional 3.6% |
| Norwegians | 100.0 /100 | #3 | Exceptional 3.7% |
| Slovenes | 100.0 /100 | #4 | Exceptional 3.8% |
| Swedes | 100.0 /100 | #5 | Exceptional 3.9% |
| Luxembourgers | 100.0 /100 | #6 | Exceptional 3.9% |
| Latvians | 100.0 /100 | #7 | Exceptional 3.9% |
| Thais | 100.0 /100 | #8 | Exceptional 3.9% |
| Croatians | 100.0 /100 | #9 | Exceptional 3.9% |
| Carpatho Rusyns | 100.0 /100 | #10 | Exceptional 3.9% |
| Lithuanians | 100.0 /100 | #11 | Exceptional 4.0% |
| Bulgarians | 100.0 /100 | #12 | Exceptional 4.0% |
| Czechs | 100.0 /100 | #13 | Exceptional 4.0% |
| Slovaks | 100.0 /100 | #14 | Exceptional 4.0% |
| Poles | 100.0 /100 | #15 | Exceptional 4.0% |
Demographics Similar to Immigrants from Haiti by Married-Couple Family Poverty
In terms of married-couple family poverty, the demographic groups most similar to Immigrants from Haiti are Guatemalan (7.0%, a difference of 1.1%), Spanish American Indian (7.1%, a difference of 1.3%), Hopi (7.1%, a difference of 1.9%), Immigrants from Nicaragua (7.1%, a difference of 1.9%), and Immigrants from Dominica (7.1%, a difference of 2.0%).
| Demographics | Rating | Rank | Married-Couple Family Poverty |
| Nicaraguans | 0.0 /100 | #299 | Tragic 6.7% |
| Immigrants | Belize | 0.0 /100 | #300 | Tragic 6.7% |
| Central Americans | 0.0 /100 | #301 | Tragic 6.7% |
| Immigrants | Ecuador | 0.0 /100 | #302 | Tragic 6.7% |
| Immigrants | El Salvador | 0.0 /100 | #303 | Tragic 6.8% |
| Cubans | 0.0 /100 | #304 | Tragic 6.8% |
| Haitians | 0.0 /100 | #305 | Tragic 6.8% |
| Immigrants | Haiti | 0.0 /100 | #306 | Tragic 7.0% |
| Guatemalans | 0.0 /100 | #307 | Tragic 7.0% |
| Spanish American Indians | 0.0 /100 | #308 | Tragic 7.1% |
| Hopi | 0.0 /100 | #309 | Tragic 7.1% |
| Immigrants | Nicaragua | 0.0 /100 | #310 | Tragic 7.1% |
| Immigrants | Dominica | 0.0 /100 | #311 | Tragic 7.1% |
| Immigrants | Armenia | 0.0 /100 | #312 | Tragic 7.1% |
| Immigrants | St. Vincent and the Grenadines | 0.0 /100 | #313 | Tragic 7.1% |