Sioux vs Immigrants from St. Vincent and the Grenadines Disability
COMPARE
Sioux
Immigrants from St. Vincent and the Grenadines
Disability
Disability Comparison
Sioux
Immigrants from St. Vincent and the Grenadines
12.8%
DISABILITY
0.0/ 100
METRIC RATING
275th/ 347
METRIC RANK
11.4%
DISABILITY
87.8/ 100
METRIC RATING
136th/ 347
METRIC RANK
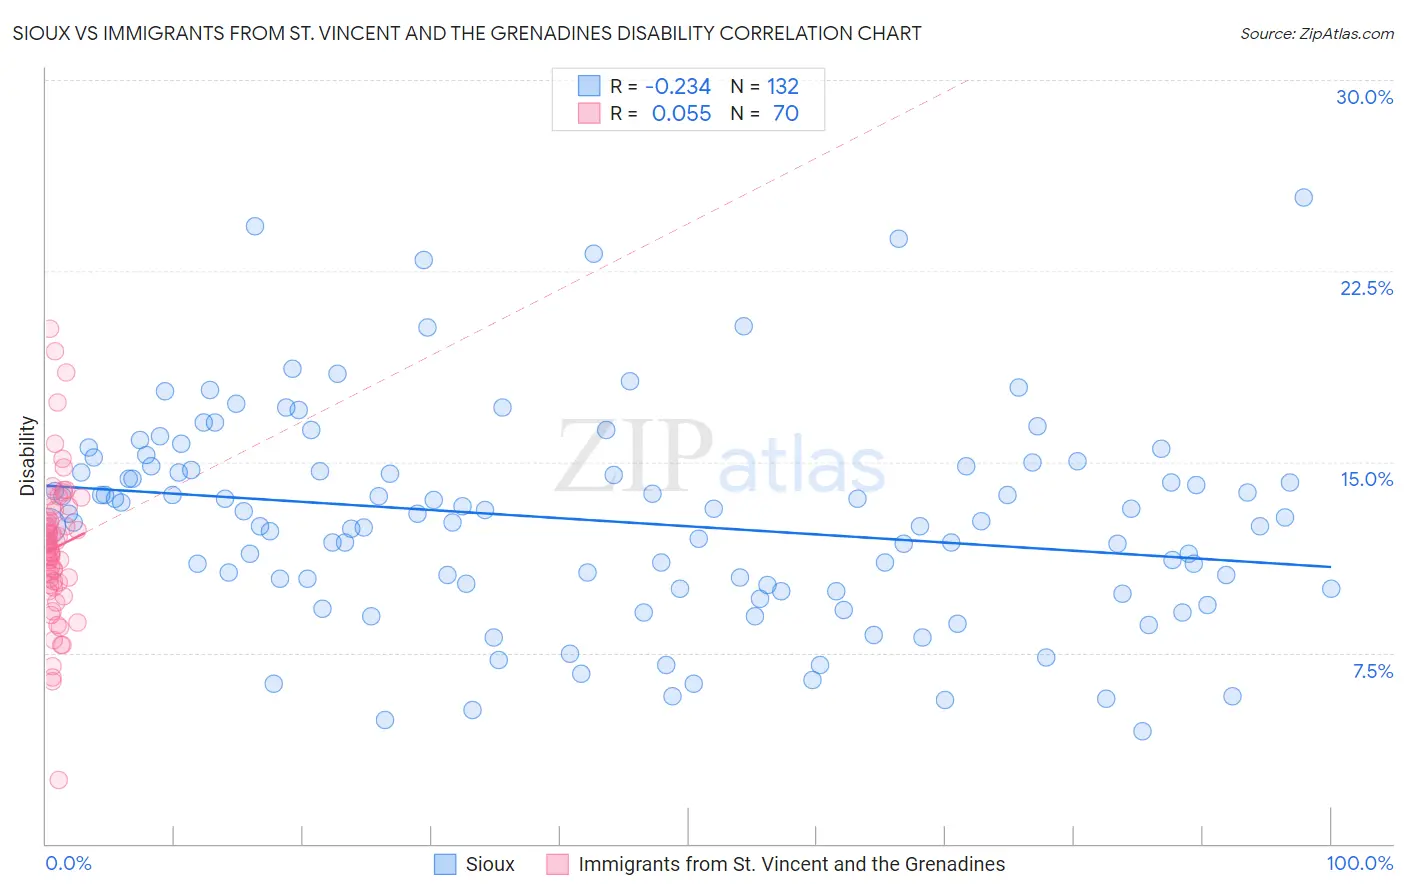
Sioux vs Immigrants from St. Vincent and the Grenadines Disability Correlation Chart
The statistical analysis conducted on geographies consisting of 234,155,753 people shows a weak negative correlation between the proportion of Sioux and percentage of population with a disability in the United States with a correlation coefficient (R) of -0.234 and weighted average of 12.8%. Similarly, the statistical analysis conducted on geographies consisting of 56,172,904 people shows a slight positive correlation between the proportion of Immigrants from St. Vincent and the Grenadines and percentage of population with a disability in the United States with a correlation coefficient (R) of 0.055 and weighted average of 11.4%, a difference of 11.7%.
Disability Correlation Summary
| Measurement | Sioux | Immigrants from St. Vincent and the Grenadines |
| Minimum | 4.4% | 2.5% |
| Maximum | 25.4% | 20.2% |
| Range | 21.0% | 17.7% |
| Mean | 12.7% | 11.6% |
| Median | 12.7% | 11.6% |
| Interquartile 25% (IQ1) | 10.0% | 10.2% |
| Interquartile 75% (IQ3) | 14.8% | 12.8% |
| Interquartile Range (IQR) | 4.7% | 2.5% |
| Standard Deviation (Sample) | 4.1% | 2.9% |
| Standard Deviation (Population) | 4.1% | 2.9% |
Similar Demographics by Disability
Demographics Similar to Sioux by Disability
In terms of disability, the demographic groups most similar to Sioux are Nepalese (12.8%, a difference of 0.080%), Hmong (12.8%, a difference of 0.15%), Dutch (12.8%, a difference of 0.20%), German (12.8%, a difference of 0.37%), and Fijian (12.8%, a difference of 0.46%).
| Demographics | Rating | Rank | Disability |
| Bangladeshis | 0.1 /100 | #268 | Tragic 12.6% |
| Immigrants | Dominican Republic | 0.1 /100 | #269 | Tragic 12.6% |
| Portuguese | 0.1 /100 | #270 | Tragic 12.6% |
| Immigrants | Yemen | 0.1 /100 | #271 | Tragic 12.6% |
| Dominicans | 0.0 /100 | #272 | Tragic 12.7% |
| Finns | 0.0 /100 | #273 | Tragic 12.7% |
| Nepalese | 0.0 /100 | #274 | Tragic 12.8% |
| Sioux | 0.0 /100 | #275 | Tragic 12.8% |
| Hmong | 0.0 /100 | #276 | Tragic 12.8% |
| Dutch | 0.0 /100 | #277 | Tragic 12.8% |
| Germans | 0.0 /100 | #278 | Tragic 12.8% |
| Fijians | 0.0 /100 | #279 | Tragic 12.8% |
| Spanish | 0.0 /100 | #280 | Tragic 12.8% |
| Immigrants | Portugal | 0.0 /100 | #281 | Tragic 12.9% |
| Scottish | 0.0 /100 | #282 | Tragic 12.9% |
Demographics Similar to Immigrants from St. Vincent and the Grenadines by Disability
In terms of disability, the demographic groups most similar to Immigrants from St. Vincent and the Grenadines are Ugandan (11.4%, a difference of 0.010%), Immigrants from Guyana (11.4%, a difference of 0.060%), Kenyan (11.5%, a difference of 0.070%), New Zealander (11.5%, a difference of 0.080%), and Ghanaian (11.5%, a difference of 0.080%).
| Demographics | Rating | Rank | Disability |
| Macedonians | 90.3 /100 | #129 | Exceptional 11.4% |
| Latvians | 89.8 /100 | #130 | Excellent 11.4% |
| Immigrants | Croatia | 89.8 /100 | #131 | Excellent 11.4% |
| Immigrants | Africa | 89.3 /100 | #132 | Excellent 11.4% |
| Arabs | 89.1 /100 | #133 | Excellent 11.4% |
| Immigrants | Guyana | 88.3 /100 | #134 | Excellent 11.4% |
| Ugandans | 87.9 /100 | #135 | Excellent 11.4% |
| Immigrants | St. Vincent and the Grenadines | 87.8 /100 | #136 | Excellent 11.4% |
| Kenyans | 87.1 /100 | #137 | Excellent 11.5% |
| New Zealanders | 87.0 /100 | #138 | Excellent 11.5% |
| Ghanaians | 87.0 /100 | #139 | Excellent 11.5% |
| Russians | 86.8 /100 | #140 | Excellent 11.5% |
| Immigrants | Grenada | 86.1 /100 | #141 | Excellent 11.5% |
| Immigrants | Sudan | 85.3 /100 | #142 | Excellent 11.5% |
| Moroccans | 83.3 /100 | #143 | Excellent 11.5% |