Taiwanese vs Immigrants from St. Vincent and the Grenadines Married-Couple Family Poverty
COMPARE
Taiwanese
Immigrants from St. Vincent and the Grenadines
Married-Couple Family Poverty
Married-Couple Family Poverty Comparison
Taiwanese
Immigrants from St. Vincent and the Grenadines
4.8%
MARRIED-COUPLE FAMILY POVERTY
94.8/ 100
METRIC RATING
115th/ 347
METRIC RANK
7.1%
MARRIED-COUPLE FAMILY POVERTY
0.0/ 100
METRIC RATING
313th/ 347
METRIC RANK
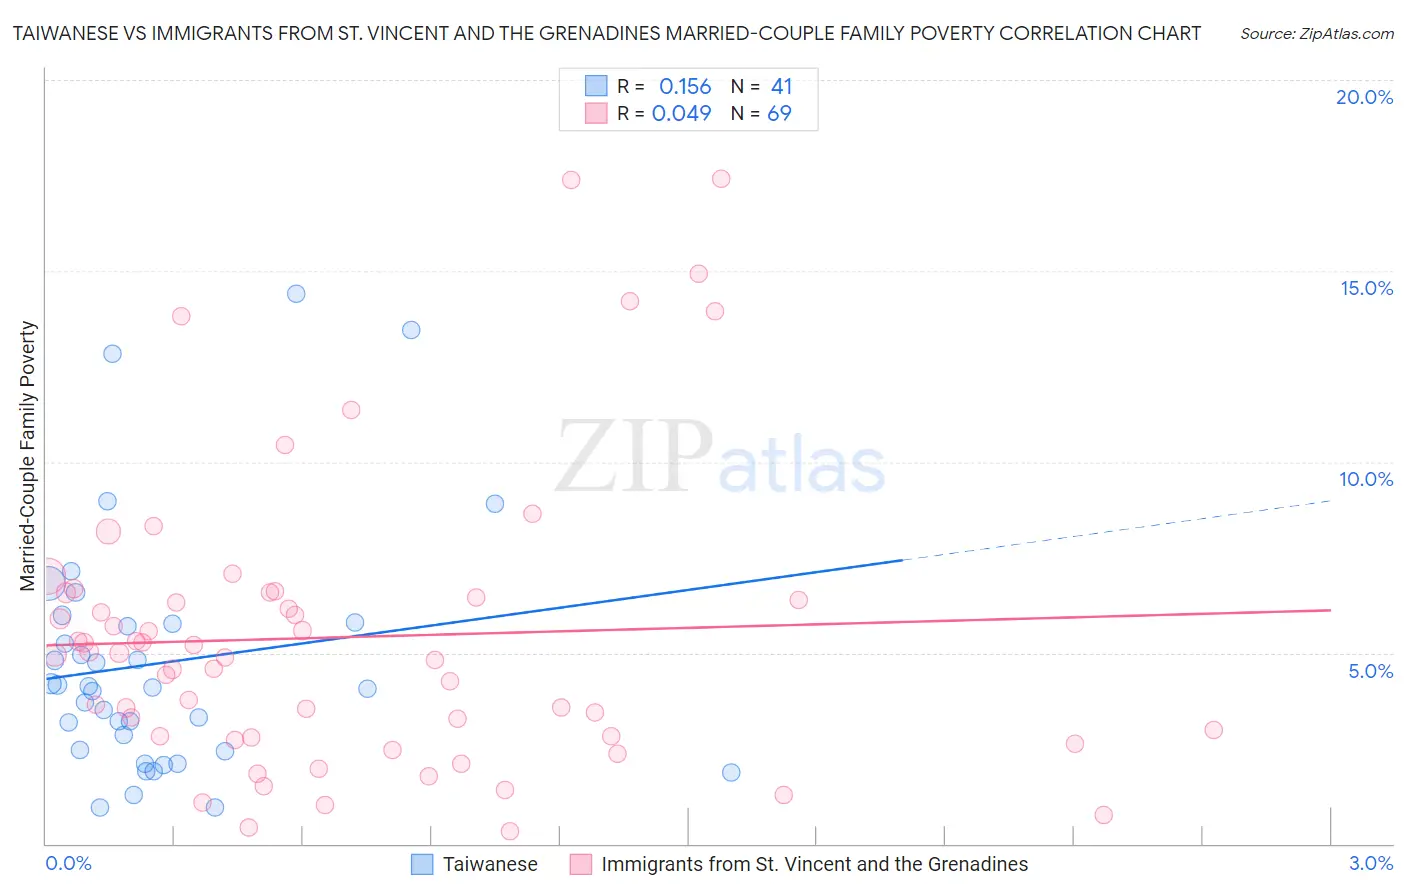
Taiwanese vs Immigrants from St. Vincent and the Grenadines Married-Couple Family Poverty Correlation Chart
The statistical analysis conducted on geographies consisting of 31,702,060 people shows a poor positive correlation between the proportion of Taiwanese and poverty level among married-couple families in the United States with a correlation coefficient (R) of 0.156 and weighted average of 4.8%. Similarly, the statistical analysis conducted on geographies consisting of 56,063,959 people shows no correlation between the proportion of Immigrants from St. Vincent and the Grenadines and poverty level among married-couple families in the United States with a correlation coefficient (R) of 0.049 and weighted average of 7.1%, a difference of 48.7%.
Married-Couple Family Poverty Correlation Summary
| Measurement | Taiwanese | Immigrants from St. Vincent and the Grenadines |
| Minimum | 0.94% | 0.34% |
| Maximum | 14.4% | 17.4% |
| Range | 13.5% | 17.1% |
| Mean | 4.7% | 5.4% |
| Median | 4.1% | 4.9% |
| Interquartile 25% (IQ1) | 2.4% | 2.8% |
| Interquartile 75% (IQ3) | 5.8% | 6.5% |
| Interquartile Range (IQR) | 3.3% | 3.7% |
| Standard Deviation (Sample) | 3.2% | 3.8% |
| Standard Deviation (Population) | 3.1% | 3.8% |
Similar Demographics by Married-Couple Family Poverty
Demographics Similar to Taiwanese by Married-Couple Family Poverty
In terms of married-couple family poverty, the demographic groups most similar to Taiwanese are Celtic (4.8%, a difference of 0.010%), Kenyan (4.8%, a difference of 0.11%), Immigrants from Philippines (4.8%, a difference of 0.13%), Immigrants from Indonesia (4.8%, a difference of 0.15%), and Immigrants from Eastern Asia (4.8%, a difference of 0.50%).
| Demographics | Rating | Rank | Married-Couple Family Poverty |
| Laotians | 96.6 /100 | #108 | Exceptional 4.7% |
| Immigrants | Hong Kong | 96.4 /100 | #109 | Exceptional 4.7% |
| Immigrants | Bolivia | 96.2 /100 | #110 | Exceptional 4.7% |
| Pakistanis | 96.2 /100 | #111 | Exceptional 4.7% |
| Tongans | 95.9 /100 | #112 | Exceptional 4.7% |
| Immigrants | Nepal | 95.9 /100 | #113 | Exceptional 4.7% |
| Immigrants | Indonesia | 95.1 /100 | #114 | Exceptional 4.8% |
| Taiwanese | 94.8 /100 | #115 | Exceptional 4.8% |
| Celtics | 94.8 /100 | #116 | Exceptional 4.8% |
| Kenyans | 94.7 /100 | #117 | Exceptional 4.8% |
| Immigrants | Philippines | 94.6 /100 | #118 | Exceptional 4.8% |
| Immigrants | Eastern Asia | 94.0 /100 | #119 | Exceptional 4.8% |
| Immigrants | Southern Europe | 93.4 /100 | #120 | Exceptional 4.8% |
| Indians (Asian) | 93.2 /100 | #121 | Exceptional 4.8% |
| Whites/Caucasians | 93.1 /100 | #122 | Exceptional 4.8% |
Demographics Similar to Immigrants from St. Vincent and the Grenadines by Married-Couple Family Poverty
In terms of married-couple family poverty, the demographic groups most similar to Immigrants from St. Vincent and the Grenadines are Immigrants from Dominica (7.1%, a difference of 0.11%), Immigrants from Armenia (7.1%, a difference of 0.11%), Immigrants from Nicaragua (7.1%, a difference of 0.17%), Hopi (7.1%, a difference of 0.19%), and British West Indian (7.1%, a difference of 0.30%).
| Demographics | Rating | Rank | Married-Couple Family Poverty |
| Immigrants | Haiti | 0.0 /100 | #306 | Tragic 7.0% |
| Guatemalans | 0.0 /100 | #307 | Tragic 7.0% |
| Spanish American Indians | 0.0 /100 | #308 | Tragic 7.1% |
| Hopi | 0.0 /100 | #309 | Tragic 7.1% |
| Immigrants | Nicaragua | 0.0 /100 | #310 | Tragic 7.1% |
| Immigrants | Dominica | 0.0 /100 | #311 | Tragic 7.1% |
| Immigrants | Armenia | 0.0 /100 | #312 | Tragic 7.1% |
| Immigrants | St. Vincent and the Grenadines | 0.0 /100 | #313 | Tragic 7.1% |
| British West Indians | 0.0 /100 | #314 | Tragic 7.1% |
| Inupiat | 0.0 /100 | #315 | Tragic 7.1% |
| Hondurans | 0.0 /100 | #316 | Tragic 7.2% |
| Mexicans | 0.0 /100 | #317 | Tragic 7.2% |
| Immigrants | Guatemala | 0.0 /100 | #318 | Tragic 7.2% |
| Immigrants | Latin America | 0.0 /100 | #319 | Tragic 7.2% |
| Immigrants | Grenada | 0.0 /100 | #320 | Tragic 7.3% |