Creek vs Trinidadian and Tobagonian Family Poverty
COMPARE
Creek
Trinidadian and Tobagonian
Family Poverty
Family Poverty Comparison
Creek
Trinidadians and Tobagonians
11.7%
FAMILY POVERTY
0.0/ 100
METRIC RATING
297th/ 347
METRIC RANK
10.9%
FAMILY POVERTY
0.1/ 100
METRIC RATING
264th/ 347
METRIC RANK
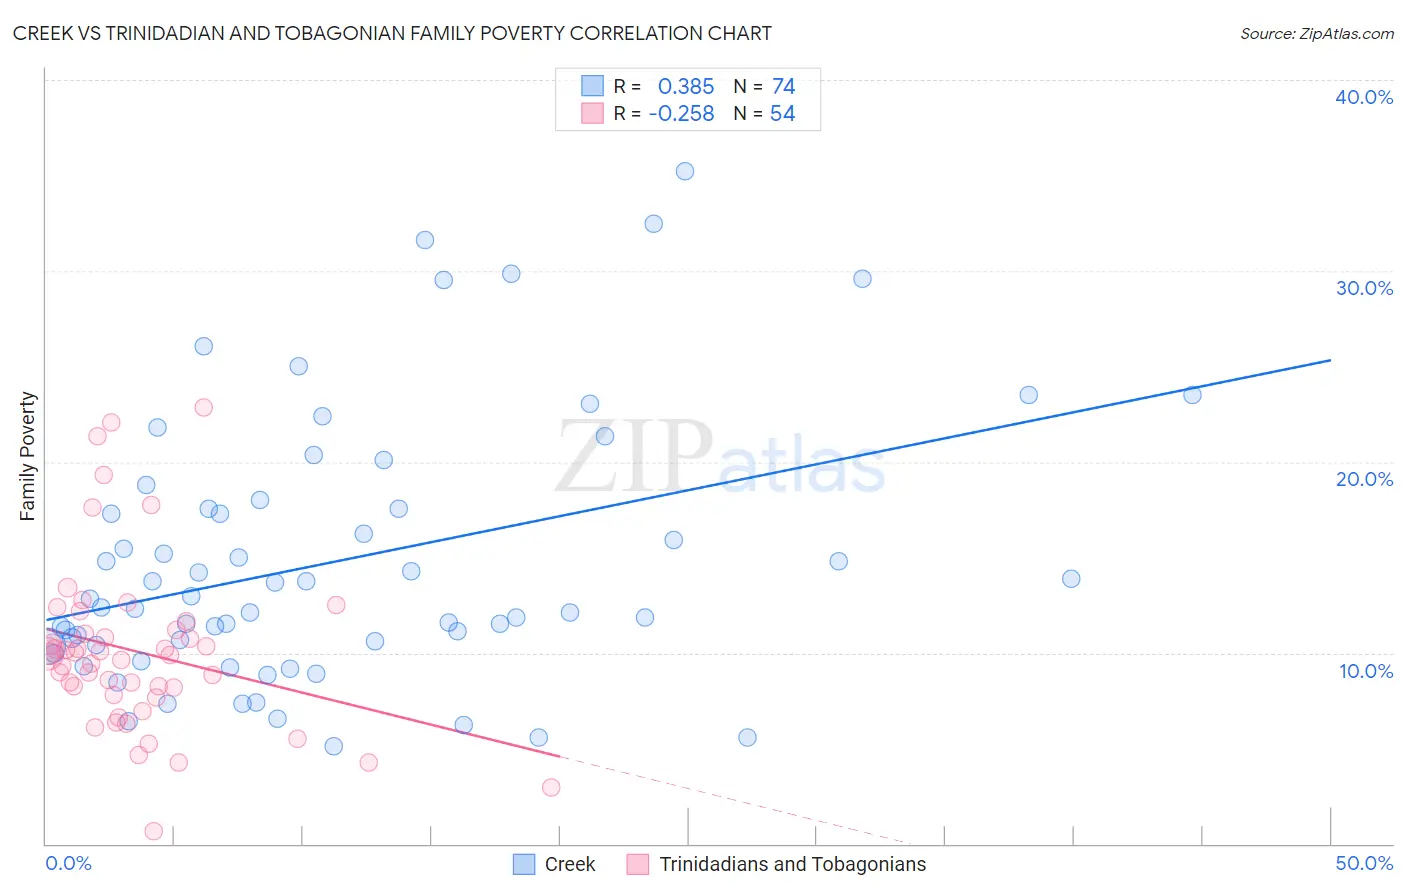
Creek vs Trinidadian and Tobagonian Family Poverty Correlation Chart
The statistical analysis conducted on geographies consisting of 178,327,636 people shows a mild positive correlation between the proportion of Creek and poverty level among families in the United States with a correlation coefficient (R) of 0.385 and weighted average of 11.7%. Similarly, the statistical analysis conducted on geographies consisting of 219,444,154 people shows a weak negative correlation between the proportion of Trinidadians and Tobagonians and poverty level among families in the United States with a correlation coefficient (R) of -0.258 and weighted average of 10.9%, a difference of 6.5%.
Family Poverty Correlation Summary
| Measurement | Creek | Trinidadian and Tobagonian |
| Minimum | 5.1% | 0.64% |
| Maximum | 35.2% | 22.8% |
| Range | 30.1% | 22.2% |
| Mean | 14.8% | 10.1% |
| Median | 12.6% | 9.9% |
| Interquartile 25% (IQ1) | 10.4% | 7.8% |
| Interquartile 75% (IQ3) | 17.6% | 11.2% |
| Interquartile Range (IQR) | 7.2% | 3.5% |
| Standard Deviation (Sample) | 7.0% | 4.5% |
| Standard Deviation (Population) | 6.9% | 4.4% |
Similar Demographics by Family Poverty
Demographics Similar to Creek by Family Poverty
In terms of family poverty, the demographic groups most similar to Creek are Immigrants from Senegal (11.7%, a difference of 0.14%), Choctaw (11.6%, a difference of 0.23%), Dutch West Indian (11.7%, a difference of 0.24%), Immigrants from Bangladesh (11.7%, a difference of 0.25%), and Immigrants from Haiti (11.6%, a difference of 0.28%).
| Demographics | Rating | Rank | Family Poverty |
| West Indians | 0.0 /100 | #290 | Tragic 11.5% |
| Haitians | 0.0 /100 | #291 | Tragic 11.5% |
| Immigrants | Somalia | 0.0 /100 | #292 | Tragic 11.5% |
| Immigrants | Cabo Verde | 0.0 /100 | #293 | Tragic 11.6% |
| Immigrants | St. Vincent and the Grenadines | 0.0 /100 | #294 | Tragic 11.6% |
| Immigrants | Haiti | 0.0 /100 | #295 | Tragic 11.6% |
| Choctaw | 0.0 /100 | #296 | Tragic 11.6% |
| Creek | 0.0 /100 | #297 | Tragic 11.7% |
| Immigrants | Senegal | 0.0 /100 | #298 | Tragic 11.7% |
| Dutch West Indians | 0.0 /100 | #299 | Tragic 11.7% |
| Immigrants | Bangladesh | 0.0 /100 | #300 | Tragic 11.7% |
| Bahamians | 0.0 /100 | #301 | Tragic 11.7% |
| Guatemalans | 0.0 /100 | #302 | Tragic 11.7% |
| Africans | 0.0 /100 | #303 | Tragic 11.8% |
| Immigrants | Latin America | 0.0 /100 | #304 | Tragic 11.8% |
Demographics Similar to Trinidadians and Tobagonians by Family Poverty
In terms of family poverty, the demographic groups most similar to Trinidadians and Tobagonians are Cape Verdean (10.9%, a difference of 0.020%), Immigrants from Trinidad and Tobago (10.9%, a difference of 0.060%), Spanish American Indian (10.9%, a difference of 0.28%), Shoshone (10.9%, a difference of 0.41%), and Bangladeshi (10.9%, a difference of 0.44%).
| Demographics | Rating | Rank | Family Poverty |
| Immigrants | Ghana | 0.2 /100 | #257 | Tragic 10.8% |
| Sub-Saharan Africans | 0.2 /100 | #258 | Tragic 10.9% |
| Mexican American Indians | 0.2 /100 | #259 | Tragic 10.9% |
| Bangladeshis | 0.2 /100 | #260 | Tragic 10.9% |
| Shoshone | 0.2 /100 | #261 | Tragic 10.9% |
| Spanish American Indians | 0.2 /100 | #262 | Tragic 10.9% |
| Cape Verdeans | 0.1 /100 | #263 | Tragic 10.9% |
| Trinidadians and Tobagonians | 0.1 /100 | #264 | Tragic 10.9% |
| Immigrants | Trinidad and Tobago | 0.1 /100 | #265 | Tragic 10.9% |
| Immigrants | El Salvador | 0.1 /100 | #266 | Tragic 11.0% |
| Comanche | 0.1 /100 | #267 | Tragic 11.0% |
| Jamaicans | 0.1 /100 | #268 | Tragic 11.1% |
| Immigrants | Ecuador | 0.1 /100 | #269 | Tragic 11.1% |
| Immigrants | Nicaragua | 0.1 /100 | #270 | Tragic 11.1% |
| Immigrants | Bahamas | 0.1 /100 | #271 | Tragic 11.1% |