Alaska Native vs Trinidadian and Tobagonian Family Poverty
COMPARE
Alaska Native
Trinidadian and Tobagonian
Family Poverty
Family Poverty Comparison
Alaska Natives
Trinidadians and Tobagonians
10.4%
FAMILY POVERTY
1.0/ 100
METRIC RATING
242nd/ 347
METRIC RANK
10.9%
FAMILY POVERTY
0.1/ 100
METRIC RATING
264th/ 347
METRIC RANK
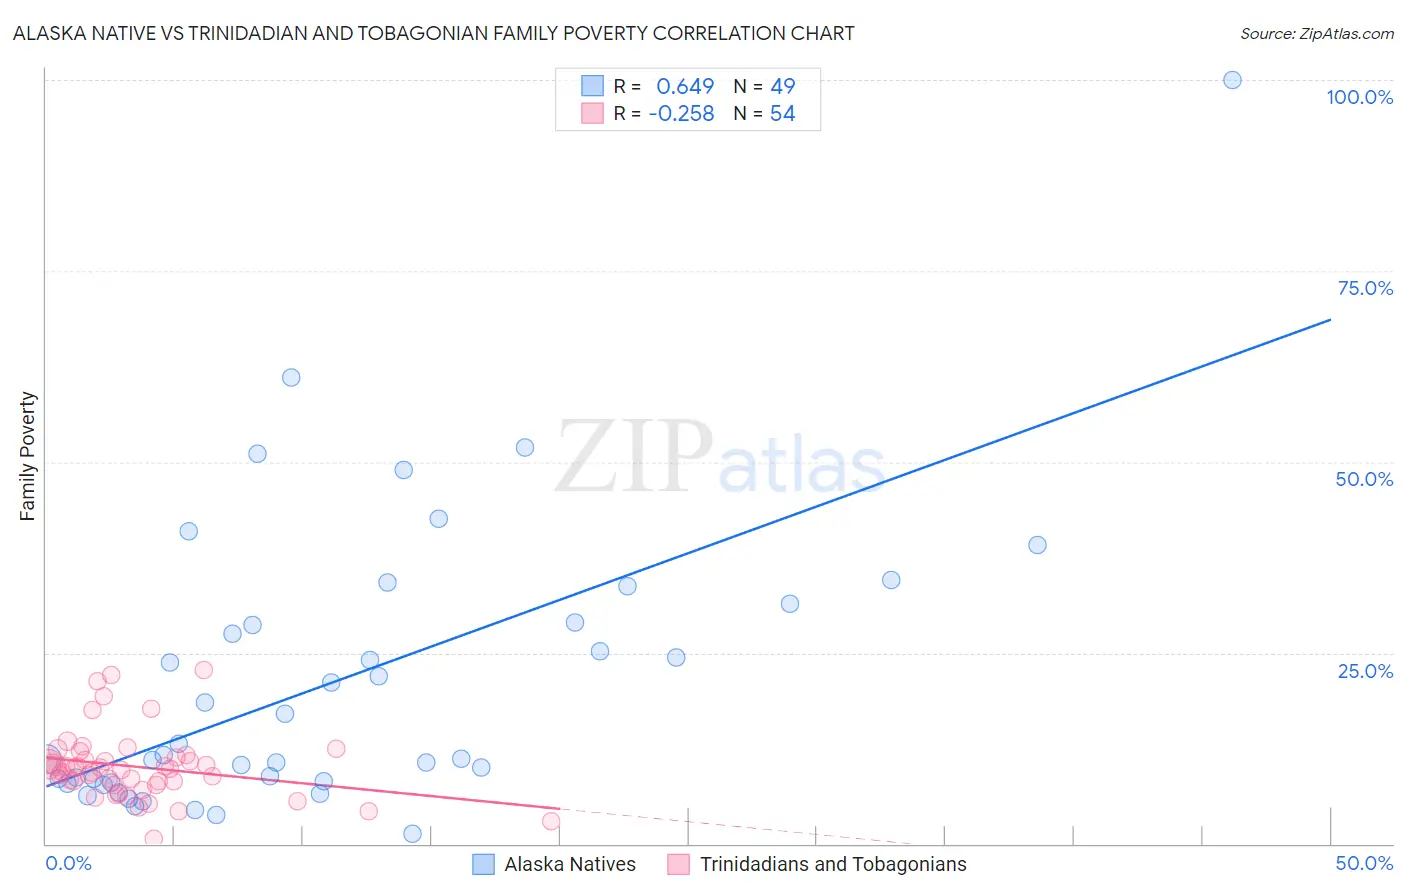
Alaska Native vs Trinidadian and Tobagonian Family Poverty Correlation Chart
The statistical analysis conducted on geographies consisting of 76,710,212 people shows a significant positive correlation between the proportion of Alaska Natives and poverty level among families in the United States with a correlation coefficient (R) of 0.649 and weighted average of 10.4%. Similarly, the statistical analysis conducted on geographies consisting of 219,444,154 people shows a weak negative correlation between the proportion of Trinidadians and Tobagonians and poverty level among families in the United States with a correlation coefficient (R) of -0.258 and weighted average of 10.9%, a difference of 5.5%.
Family Poverty Correlation Summary
| Measurement | Alaska Native | Trinidadian and Tobagonian |
| Minimum | 1.3% | 0.64% |
| Maximum | 100.0% | 22.8% |
| Range | 98.7% | 22.2% |
| Mean | 21.3% | 10.1% |
| Median | 11.6% | 9.9% |
| Interquartile 25% (IQ1) | 8.1% | 7.8% |
| Interquartile 75% (IQ3) | 30.2% | 11.2% |
| Interquartile Range (IQR) | 22.0% | 3.5% |
| Standard Deviation (Sample) | 18.8% | 4.5% |
| Standard Deviation (Population) | 18.6% | 4.4% |
Similar Demographics by Family Poverty
Demographics Similar to Alaska Natives by Family Poverty
In terms of family poverty, the demographic groups most similar to Alaska Natives are Nepalese (10.4%, a difference of 0.48%), Ghanaian (10.3%, a difference of 0.86%), Cree (10.5%, a difference of 0.94%), Immigrants from the Azores (10.3%, a difference of 0.95%), and Potawatomi (10.2%, a difference of 1.3%).
| Demographics | Rating | Rank | Family Poverty |
| Nigerians | 2.0 /100 | #235 | Tragic 10.1% |
| Immigrants | Nigeria | 1.9 /100 | #236 | Tragic 10.2% |
| Immigrants | Laos | 1.7 /100 | #237 | Tragic 10.2% |
| French American Indians | 1.5 /100 | #238 | Tragic 10.2% |
| Potawatomi | 1.5 /100 | #239 | Tragic 10.2% |
| Immigrants | Azores | 1.4 /100 | #240 | Tragic 10.3% |
| Ghanaians | 1.3 /100 | #241 | Tragic 10.3% |
| Alaska Natives | 1.0 /100 | #242 | Tragic 10.4% |
| Nepalese | 0.8 /100 | #243 | Tragic 10.4% |
| Cree | 0.7 /100 | #244 | Tragic 10.5% |
| Immigrants | Burma/Myanmar | 0.6 /100 | #245 | Tragic 10.5% |
| Cherokee | 0.5 /100 | #246 | Tragic 10.6% |
| Liberians | 0.4 /100 | #247 | Tragic 10.6% |
| Nicaraguans | 0.4 /100 | #248 | Tragic 10.6% |
| Cubans | 0.4 /100 | #249 | Tragic 10.6% |
Demographics Similar to Trinidadians and Tobagonians by Family Poverty
In terms of family poverty, the demographic groups most similar to Trinidadians and Tobagonians are Cape Verdean (10.9%, a difference of 0.020%), Immigrants from Trinidad and Tobago (10.9%, a difference of 0.060%), Spanish American Indian (10.9%, a difference of 0.28%), Shoshone (10.9%, a difference of 0.41%), and Bangladeshi (10.9%, a difference of 0.44%).
| Demographics | Rating | Rank | Family Poverty |
| Immigrants | Ghana | 0.2 /100 | #257 | Tragic 10.8% |
| Sub-Saharan Africans | 0.2 /100 | #258 | Tragic 10.9% |
| Mexican American Indians | 0.2 /100 | #259 | Tragic 10.9% |
| Bangladeshis | 0.2 /100 | #260 | Tragic 10.9% |
| Shoshone | 0.2 /100 | #261 | Tragic 10.9% |
| Spanish American Indians | 0.2 /100 | #262 | Tragic 10.9% |
| Cape Verdeans | 0.1 /100 | #263 | Tragic 10.9% |
| Trinidadians and Tobagonians | 0.1 /100 | #264 | Tragic 10.9% |
| Immigrants | Trinidad and Tobago | 0.1 /100 | #265 | Tragic 10.9% |
| Immigrants | El Salvador | 0.1 /100 | #266 | Tragic 11.0% |
| Comanche | 0.1 /100 | #267 | Tragic 11.0% |
| Jamaicans | 0.1 /100 | #268 | Tragic 11.1% |
| Immigrants | Ecuador | 0.1 /100 | #269 | Tragic 11.1% |
| Immigrants | Nicaragua | 0.1 /100 | #270 | Tragic 11.1% |
| Immigrants | Bahamas | 0.1 /100 | #271 | Tragic 11.1% |