Panamanian vs Trinidadian and Tobagonian Family Poverty
COMPARE
Panamanian
Trinidadian and Tobagonian
Family Poverty
Family Poverty Comparison
Panamanians
Trinidadians and Tobagonians
9.8%
FAMILY POVERTY
5.6/ 100
METRIC RATING
218th/ 347
METRIC RANK
10.9%
FAMILY POVERTY
0.1/ 100
METRIC RATING
264th/ 347
METRIC RANK
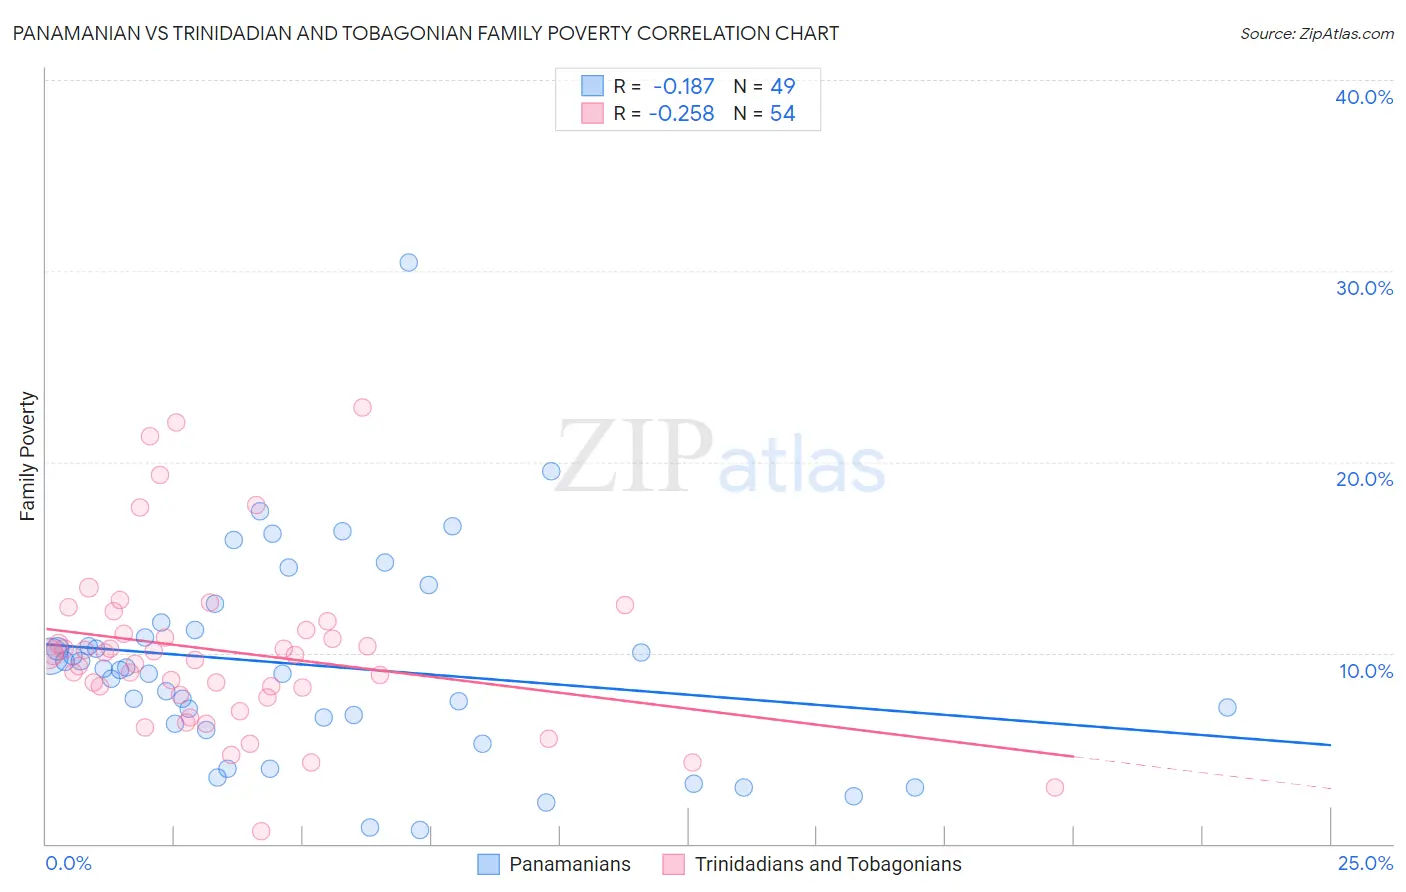
Panamanian vs Trinidadian and Tobagonian Family Poverty Correlation Chart
The statistical analysis conducted on geographies consisting of 280,803,114 people shows a poor negative correlation between the proportion of Panamanians and poverty level among families in the United States with a correlation coefficient (R) of -0.187 and weighted average of 9.8%. Similarly, the statistical analysis conducted on geographies consisting of 219,444,154 people shows a weak negative correlation between the proportion of Trinidadians and Tobagonians and poverty level among families in the United States with a correlation coefficient (R) of -0.258 and weighted average of 10.9%, a difference of 11.2%.
Family Poverty Correlation Summary
| Measurement | Panamanian | Trinidadian and Tobagonian |
| Minimum | 0.72% | 0.64% |
| Maximum | 30.4% | 22.8% |
| Range | 29.7% | 22.2% |
| Mean | 9.3% | 10.1% |
| Median | 9.1% | 9.9% |
| Interquartile 25% (IQ1) | 6.1% | 7.8% |
| Interquartile 75% (IQ3) | 11.4% | 11.2% |
| Interquartile Range (IQR) | 5.3% | 3.5% |
| Standard Deviation (Sample) | 5.5% | 4.5% |
| Standard Deviation (Population) | 5.4% | 4.4% |
Similar Demographics by Family Poverty
Demographics Similar to Panamanians by Family Poverty
In terms of family poverty, the demographic groups most similar to Panamanians are Immigrants from Eritrea (9.9%, a difference of 0.13%), Bermudan (9.9%, a difference of 0.18%), American (9.8%, a difference of 0.32%), Immigrants from Cambodia (9.9%, a difference of 0.46%), and Japanese (9.9%, a difference of 0.49%).
| Demographics | Rating | Rank | Family Poverty |
| Malaysians | 10.6 /100 | #211 | Poor 9.6% |
| Immigrants | Thailand | 9.7 /100 | #212 | Tragic 9.7% |
| Osage | 8.0 /100 | #213 | Tragic 9.7% |
| Immigrants | Micronesia | 6.7 /100 | #214 | Tragic 9.8% |
| Immigrants | Nonimmigrants | 6.7 /100 | #215 | Tragic 9.8% |
| Moroccans | 6.5 /100 | #216 | Tragic 9.8% |
| Americans | 6.2 /100 | #217 | Tragic 9.8% |
| Panamanians | 5.6 /100 | #218 | Tragic 9.8% |
| Immigrants | Eritrea | 5.4 /100 | #219 | Tragic 9.9% |
| Bermudans | 5.3 /100 | #220 | Tragic 9.9% |
| Immigrants | Cambodia | 4.8 /100 | #221 | Tragic 9.9% |
| Japanese | 4.8 /100 | #222 | Tragic 9.9% |
| Immigrants | Africa | 4.3 /100 | #223 | Tragic 9.9% |
| Marshallese | 3.9 /100 | #224 | Tragic 9.9% |
| Immigrants | Immigrants | 3.6 /100 | #225 | Tragic 10.0% |
Demographics Similar to Trinidadians and Tobagonians by Family Poverty
In terms of family poverty, the demographic groups most similar to Trinidadians and Tobagonians are Cape Verdean (10.9%, a difference of 0.020%), Immigrants from Trinidad and Tobago (10.9%, a difference of 0.060%), Spanish American Indian (10.9%, a difference of 0.28%), Shoshone (10.9%, a difference of 0.41%), and Bangladeshi (10.9%, a difference of 0.44%).
| Demographics | Rating | Rank | Family Poverty |
| Immigrants | Ghana | 0.2 /100 | #257 | Tragic 10.8% |
| Sub-Saharan Africans | 0.2 /100 | #258 | Tragic 10.9% |
| Mexican American Indians | 0.2 /100 | #259 | Tragic 10.9% |
| Bangladeshis | 0.2 /100 | #260 | Tragic 10.9% |
| Shoshone | 0.2 /100 | #261 | Tragic 10.9% |
| Spanish American Indians | 0.2 /100 | #262 | Tragic 10.9% |
| Cape Verdeans | 0.1 /100 | #263 | Tragic 10.9% |
| Trinidadians and Tobagonians | 0.1 /100 | #264 | Tragic 10.9% |
| Immigrants | Trinidad and Tobago | 0.1 /100 | #265 | Tragic 10.9% |
| Immigrants | El Salvador | 0.1 /100 | #266 | Tragic 11.0% |
| Comanche | 0.1 /100 | #267 | Tragic 11.0% |
| Jamaicans | 0.1 /100 | #268 | Tragic 11.1% |
| Immigrants | Ecuador | 0.1 /100 | #269 | Tragic 11.1% |
| Immigrants | Nicaragua | 0.1 /100 | #270 | Tragic 11.1% |
| Immigrants | Bahamas | 0.1 /100 | #271 | Tragic 11.1% |