Scandinavian vs Trinidadian and Tobagonian Ambulatory Disability
COMPARE
Scandinavian
Trinidadian and Tobagonian
Ambulatory Disability
Ambulatory Disability Comparison
Scandinavians
Trinidadians and Tobagonians
6.1%
AMBULATORY DISABILITY
44.5/ 100
METRIC RATING
178th/ 347
METRIC RANK
6.6%
AMBULATORY DISABILITY
0.2/ 100
METRIC RATING
267th/ 347
METRIC RANK
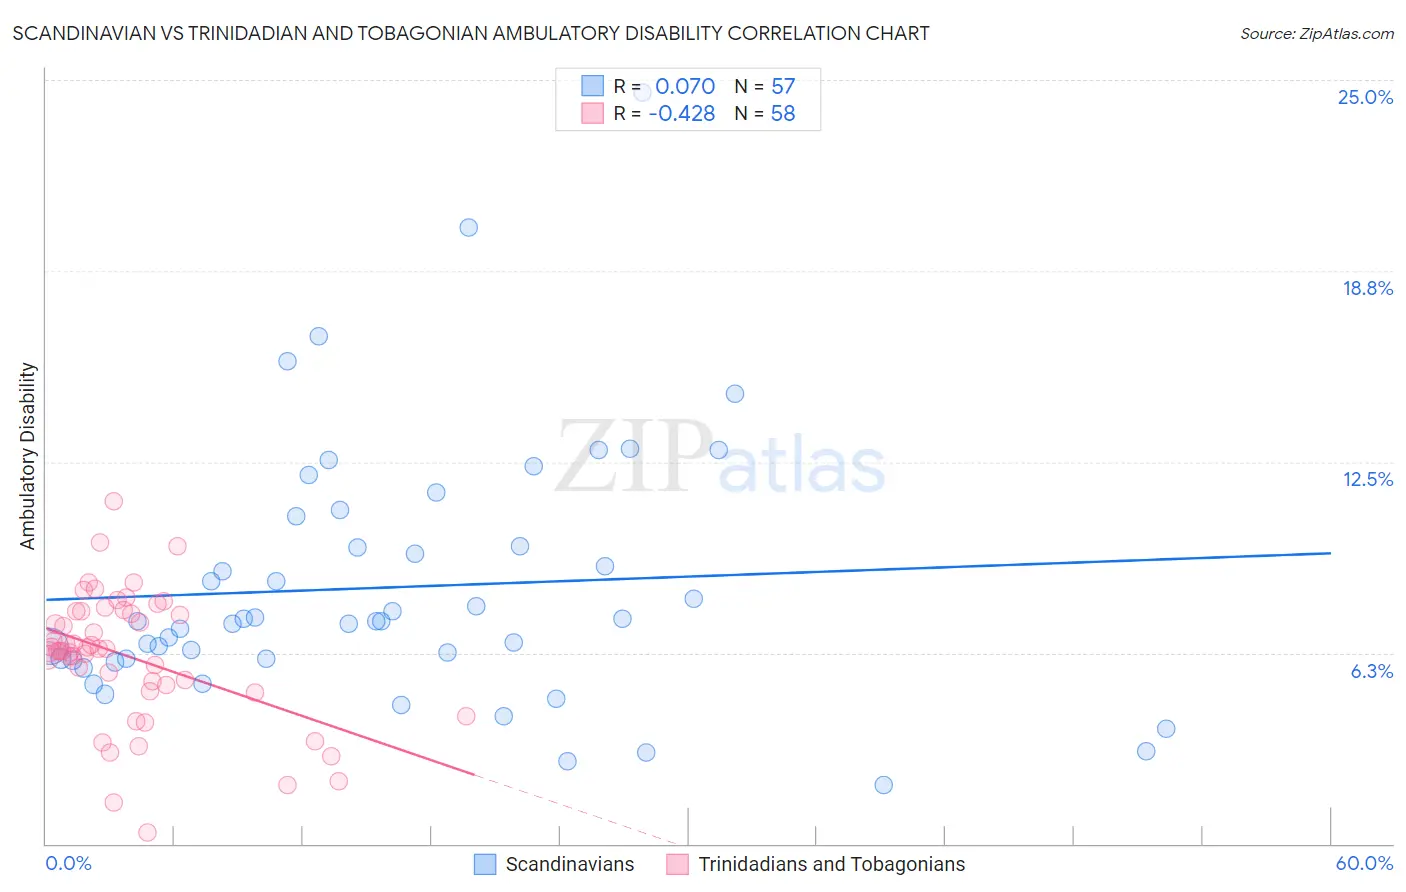
Scandinavian vs Trinidadian and Tobagonian Ambulatory Disability Correlation Chart
The statistical analysis conducted on geographies consisting of 472,401,593 people shows a slight positive correlation between the proportion of Scandinavians and percentage of population with ambulatory disability in the United States with a correlation coefficient (R) of 0.070 and weighted average of 6.1%. Similarly, the statistical analysis conducted on geographies consisting of 219,787,552 people shows a moderate negative correlation between the proportion of Trinidadians and Tobagonians and percentage of population with ambulatory disability in the United States with a correlation coefficient (R) of -0.428 and weighted average of 6.6%, a difference of 8.0%.
Ambulatory Disability Correlation Summary
| Measurement | Scandinavian | Trinidadian and Tobagonian |
| Minimum | 1.9% | 0.38% |
| Maximum | 24.6% | 11.2% |
| Range | 22.7% | 10.8% |
| Mean | 8.4% | 6.1% |
| Median | 7.3% | 6.3% |
| Interquartile 25% (IQ1) | 6.0% | 5.2% |
| Interquartile 75% (IQ3) | 10.2% | 7.6% |
| Interquartile Range (IQR) | 4.2% | 2.4% |
| Standard Deviation (Sample) | 4.2% | 2.1% |
| Standard Deviation (Population) | 4.2% | 2.1% |
Similar Demographics by Ambulatory Disability
Demographics Similar to Scandinavians by Ambulatory Disability
In terms of ambulatory disability, the demographic groups most similar to Scandinavians are Austrian (6.1%, a difference of 0.020%), Immigrants from Nicaragua (6.1%, a difference of 0.030%), Immigrants from England (6.1%, a difference of 0.050%), Immigrants from North America (6.1%, a difference of 0.060%), and Swiss (6.1%, a difference of 0.080%).
| Demographics | Rating | Rank | Ambulatory Disability |
| Moroccans | 52.6 /100 | #171 | Average 6.1% |
| Immigrants | Burma/Myanmar | 52.2 /100 | #172 | Average 6.1% |
| Croatians | 51.2 /100 | #173 | Average 6.1% |
| Immigrants | Canada | 50.0 /100 | #174 | Average 6.1% |
| Vietnamese | 47.2 /100 | #175 | Average 6.1% |
| Immigrants | North America | 45.6 /100 | #176 | Average 6.1% |
| Immigrants | England | 45.4 /100 | #177 | Average 6.1% |
| Scandinavians | 44.5 /100 | #178 | Average 6.1% |
| Austrians | 44.1 /100 | #179 | Average 6.1% |
| Immigrants | Nicaragua | 43.9 /100 | #180 | Average 6.1% |
| Swiss | 43.1 /100 | #181 | Average 6.1% |
| Serbians | 42.8 /100 | #182 | Average 6.1% |
| Immigrants | Thailand | 42.2 /100 | #183 | Average 6.1% |
| Immigrants | Ghana | 41.2 /100 | #184 | Average 6.1% |
| Immigrants | Bosnia and Herzegovina | 37.2 /100 | #185 | Fair 6.2% |
Demographics Similar to Trinidadians and Tobagonians by Ambulatory Disability
In terms of ambulatory disability, the demographic groups most similar to Trinidadians and Tobagonians are Spanish (6.6%, a difference of 0.020%), Guyanese (6.6%, a difference of 0.13%), Bahamian (6.6%, a difference of 0.25%), Nepalese (6.6%, a difference of 0.31%), and French (6.6%, a difference of 0.32%).
| Demographics | Rating | Rank | Ambulatory Disability |
| Immigrants | Belize | 0.4 /100 | #260 | Tragic 6.6% |
| Irish | 0.4 /100 | #261 | Tragic 6.6% |
| English | 0.4 /100 | #262 | Tragic 6.6% |
| Hmong | 0.3 /100 | #263 | Tragic 6.6% |
| Nepalese | 0.2 /100 | #264 | Tragic 6.6% |
| Bahamians | 0.2 /100 | #265 | Tragic 6.6% |
| Guyanese | 0.2 /100 | #266 | Tragic 6.6% |
| Trinidadians and Tobagonians | 0.2 /100 | #267 | Tragic 6.6% |
| Spanish | 0.2 /100 | #268 | Tragic 6.6% |
| French | 0.1 /100 | #269 | Tragic 6.6% |
| Slovaks | 0.1 /100 | #270 | Tragic 6.7% |
| Immigrants | Trinidad and Tobago | 0.1 /100 | #271 | Tragic 6.7% |
| French Canadians | 0.1 /100 | #272 | Tragic 6.7% |
| Whites/Caucasians | 0.1 /100 | #273 | Tragic 6.7% |
| Sioux | 0.1 /100 | #274 | Tragic 6.7% |