Cree vs Trinidadian and Tobagonian Family Poverty
COMPARE
Cree
Trinidadian and Tobagonian
Family Poverty
Family Poverty Comparison
Cree
Trinidadians and Tobagonians
10.5%
FAMILY POVERTY
0.7/ 100
METRIC RATING
244th/ 347
METRIC RANK
10.9%
FAMILY POVERTY
0.1/ 100
METRIC RATING
264th/ 347
METRIC RANK
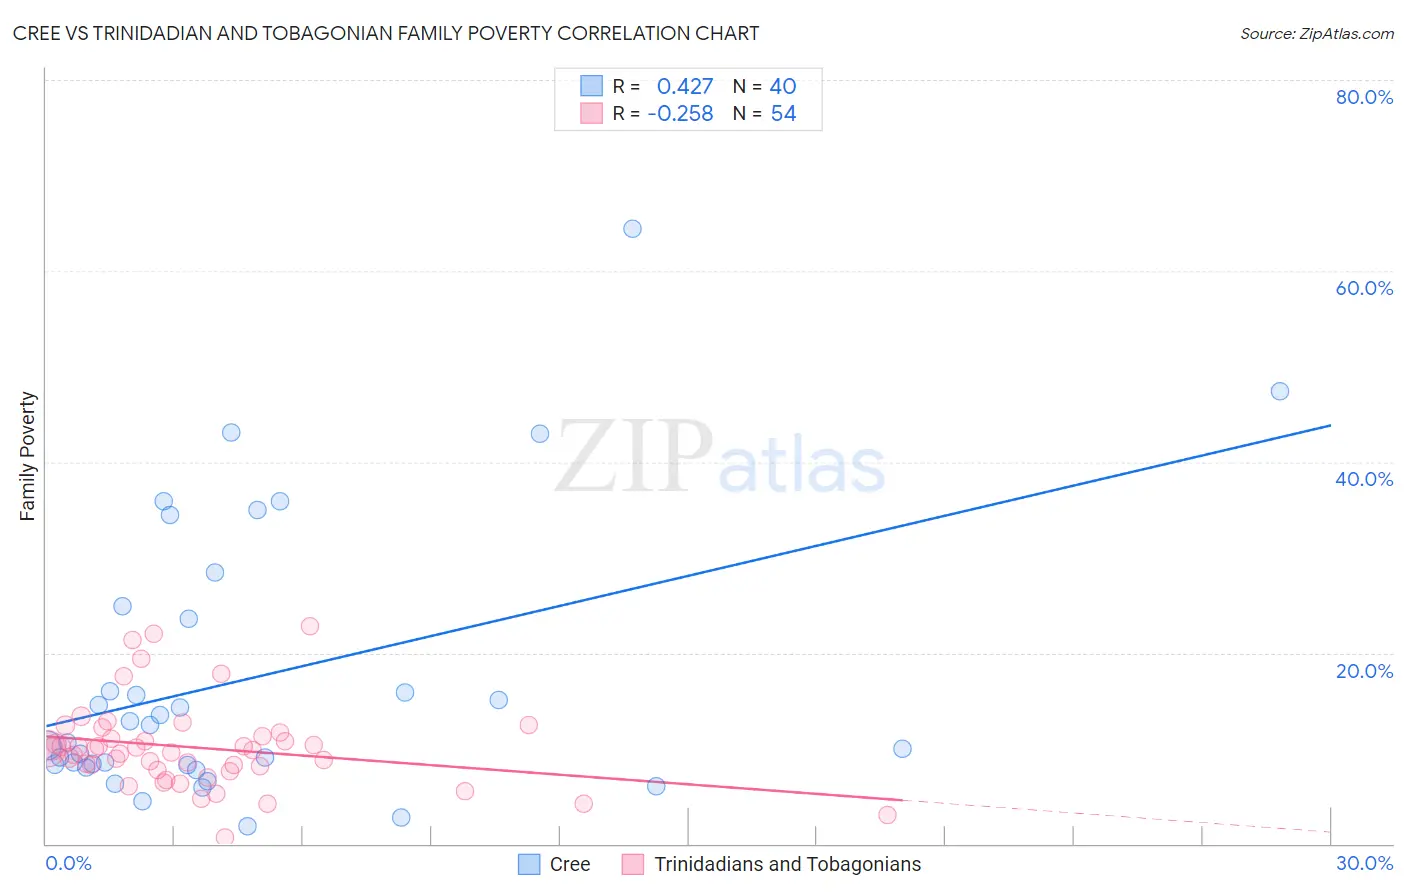
Cree vs Trinidadian and Tobagonian Family Poverty Correlation Chart
The statistical analysis conducted on geographies consisting of 76,172,191 people shows a moderate positive correlation between the proportion of Cree and poverty level among families in the United States with a correlation coefficient (R) of 0.427 and weighted average of 10.5%. Similarly, the statistical analysis conducted on geographies consisting of 219,444,154 people shows a weak negative correlation between the proportion of Trinidadians and Tobagonians and poverty level among families in the United States with a correlation coefficient (R) of -0.258 and weighted average of 10.9%, a difference of 4.6%.
Family Poverty Correlation Summary
| Measurement | Cree | Trinidadian and Tobagonian |
| Minimum | 1.8% | 0.64% |
| Maximum | 64.4% | 22.8% |
| Range | 62.6% | 22.2% |
| Mean | 17.4% | 10.1% |
| Median | 11.6% | 9.9% |
| Interquartile 25% (IQ1) | 8.3% | 7.8% |
| Interquartile 75% (IQ3) | 24.2% | 11.2% |
| Interquartile Range (IQR) | 16.0% | 3.5% |
| Standard Deviation (Sample) | 14.4% | 4.5% |
| Standard Deviation (Population) | 14.2% | 4.4% |
Demographics Similar to Cree and Trinidadians and Tobagonians by Family Poverty
In terms of family poverty, the demographic groups most similar to Cree are Immigrants from Burma/Myanmar (10.5%, a difference of 0.61%), Cherokee (10.6%, a difference of 1.3%), Liberian (10.6%, a difference of 1.3%), Nicaraguan (10.6%, a difference of 1.5%), and Cuban (10.6%, a difference of 1.6%). Similarly, the demographic groups most similar to Trinidadians and Tobagonians are Cape Verdean (10.9%, a difference of 0.020%), Spanish American Indian (10.9%, a difference of 0.28%), Shoshone (10.9%, a difference of 0.41%), Bangladeshi (10.9%, a difference of 0.44%), and Mexican American Indian (10.9%, a difference of 0.79%).
| Demographics | Rating | Rank | Family Poverty |
| Cree | 0.7 /100 | #244 | Tragic 10.5% |
| Immigrants | Burma/Myanmar | 0.6 /100 | #245 | Tragic 10.5% |
| Cherokee | 0.5 /100 | #246 | Tragic 10.6% |
| Liberians | 0.4 /100 | #247 | Tragic 10.6% |
| Nicaraguans | 0.4 /100 | #248 | Tragic 10.6% |
| Cubans | 0.4 /100 | #249 | Tragic 10.6% |
| Salvadorans | 0.3 /100 | #250 | Tragic 10.7% |
| Iroquois | 0.3 /100 | #251 | Tragic 10.7% |
| Immigrants | Zaire | 0.3 /100 | #252 | Tragic 10.7% |
| Immigrants | Western Africa | 0.3 /100 | #253 | Tragic 10.7% |
| Ecuadorians | 0.2 /100 | #254 | Tragic 10.8% |
| Immigrants | Liberia | 0.2 /100 | #255 | Tragic 10.8% |
| Chickasaw | 0.2 /100 | #256 | Tragic 10.8% |
| Immigrants | Ghana | 0.2 /100 | #257 | Tragic 10.8% |
| Sub-Saharan Africans | 0.2 /100 | #258 | Tragic 10.9% |
| Mexican American Indians | 0.2 /100 | #259 | Tragic 10.9% |
| Bangladeshis | 0.2 /100 | #260 | Tragic 10.9% |
| Shoshone | 0.2 /100 | #261 | Tragic 10.9% |
| Spanish American Indians | 0.2 /100 | #262 | Tragic 10.9% |
| Cape Verdeans | 0.1 /100 | #263 | Tragic 10.9% |
| Trinidadians and Tobagonians | 0.1 /100 | #264 | Tragic 10.9% |