Scandinavian vs Trinidadian and Tobagonian Female Poverty
COMPARE
Scandinavian
Trinidadian and Tobagonian
Female Poverty
Female Poverty Comparison
Scandinavians
Trinidadians and Tobagonians
12.1%
FEMALE POVERTY
98.2/ 100
METRIC RATING
58th/ 347
METRIC RANK
15.4%
FEMALE POVERTY
0.2/ 100
METRIC RATING
254th/ 347
METRIC RANK
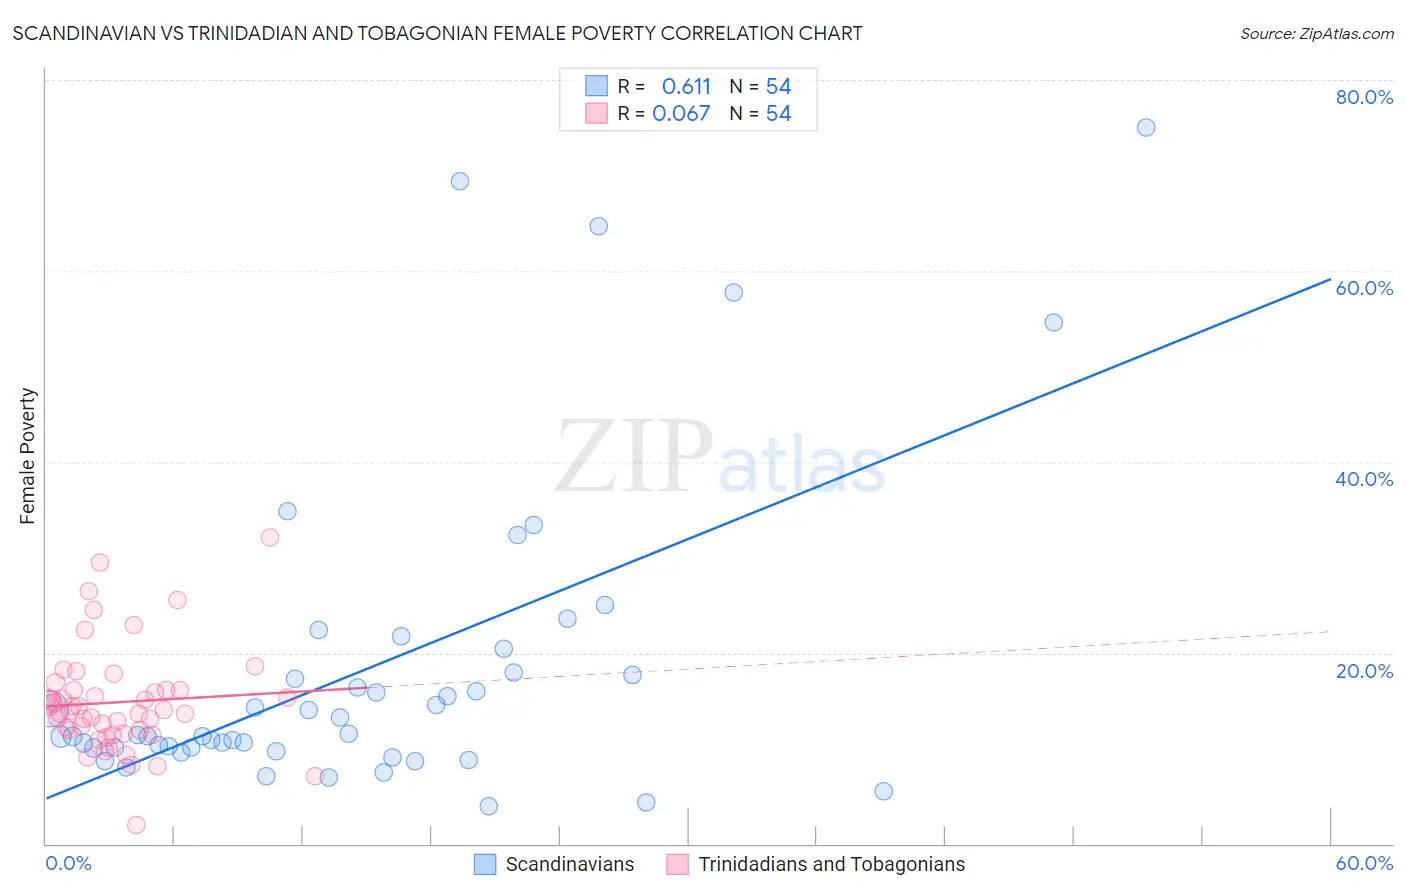
Scandinavian vs Trinidadian and Tobagonian Female Poverty Correlation Chart
The statistical analysis conducted on geographies consisting of 472,075,178 people shows a significant positive correlation between the proportion of Scandinavians and poverty level among females in the United States with a correlation coefficient (R) of 0.611 and weighted average of 12.1%. Similarly, the statistical analysis conducted on geographies consisting of 219,692,358 people shows a slight positive correlation between the proportion of Trinidadians and Tobagonians and poverty level among females in the United States with a correlation coefficient (R) of 0.067 and weighted average of 15.4%, a difference of 27.2%.
Female Poverty Correlation Summary
| Measurement | Scandinavian | Trinidadian and Tobagonian |
| Minimum | 3.9% | 2.0% |
| Maximum | 75.0% | 32.1% |
| Range | 71.1% | 30.1% |
| Mean | 18.4% | 14.8% |
| Median | 11.3% | 13.9% |
| Interquartile 25% (IQ1) | 10.0% | 11.9% |
| Interquartile 75% (IQ3) | 18.0% | 16.1% |
| Interquartile Range (IQR) | 7.9% | 4.2% |
| Standard Deviation (Sample) | 16.4% | 5.5% |
| Standard Deviation (Population) | 16.2% | 5.4% |
Similar Demographics by Female Poverty
Demographics Similar to Scandinavians by Female Poverty
In terms of female poverty, the demographic groups most similar to Scandinavians are Immigrants from Europe (12.1%, a difference of 0.010%), Immigrants from Serbia (12.1%, a difference of 0.080%), Estonian (12.1%, a difference of 0.14%), Immigrants from Australia (12.2%, a difference of 0.25%), and Immigrants from Asia (12.2%, a difference of 0.26%).
| Demographics | Rating | Rank | Female Poverty |
| Immigrants | Bulgaria | 98.9 /100 | #51 | Exceptional 12.0% |
| Immigrants | Croatia | 98.7 /100 | #52 | Exceptional 12.0% |
| Immigrants | Austria | 98.7 /100 | #53 | Exceptional 12.0% |
| Immigrants | Philippines | 98.7 /100 | #54 | Exceptional 12.1% |
| Immigrants | Sri Lanka | 98.5 /100 | #55 | Exceptional 12.1% |
| Estonians | 98.3 /100 | #56 | Exceptional 12.1% |
| Immigrants | Serbia | 98.3 /100 | #57 | Exceptional 12.1% |
| Scandinavians | 98.2 /100 | #58 | Exceptional 12.1% |
| Immigrants | Europe | 98.2 /100 | #59 | Exceptional 12.1% |
| Immigrants | Australia | 98.1 /100 | #60 | Exceptional 12.2% |
| Immigrants | Asia | 98.1 /100 | #61 | Exceptional 12.2% |
| Immigrants | Italy | 98.0 /100 | #62 | Exceptional 12.2% |
| Ukrainians | 98.0 /100 | #63 | Exceptional 12.2% |
| Germans | 98.0 /100 | #64 | Exceptional 12.2% |
| Indians (Asian) | 97.9 /100 | #65 | Exceptional 12.2% |
Demographics Similar to Trinidadians and Tobagonians by Female Poverty
In terms of female poverty, the demographic groups most similar to Trinidadians and Tobagonians are Liberian (15.4%, a difference of 0.24%), Ottawa (15.5%, a difference of 0.31%), Immigrants from Burma/Myanmar (15.4%, a difference of 0.50%), Immigrants from Trinidad and Tobago (15.4%, a difference of 0.53%), and Jamaican (15.5%, a difference of 0.61%).
| Demographics | Rating | Rank | Female Poverty |
| Potawatomi | 0.3 /100 | #247 | Tragic 15.3% |
| Immigrants | Ghana | 0.3 /100 | #248 | Tragic 15.3% |
| Salvadorans | 0.3 /100 | #249 | Tragic 15.3% |
| Immigrants | Western Africa | 0.3 /100 | #250 | Tragic 15.3% |
| Immigrants | Trinidad and Tobago | 0.3 /100 | #251 | Tragic 15.4% |
| Immigrants | Burma/Myanmar | 0.3 /100 | #252 | Tragic 15.4% |
| Liberians | 0.2 /100 | #253 | Tragic 15.4% |
| Trinidadians and Tobagonians | 0.2 /100 | #254 | Tragic 15.4% |
| Ottawa | 0.2 /100 | #255 | Tragic 15.5% |
| Jamaicans | 0.2 /100 | #256 | Tragic 15.5% |
| Immigrants | Jamaica | 0.1 /100 | #257 | Tragic 15.6% |
| Shoshone | 0.1 /100 | #258 | Tragic 15.6% |
| Cape Verdeans | 0.1 /100 | #259 | Tragic 15.6% |
| Immigrants | Guyana | 0.1 /100 | #260 | Tragic 15.6% |
| Guyanese | 0.1 /100 | #261 | Tragic 15.6% |