Afghan vs Trinidadian and Tobagonian Family Poverty
COMPARE
Afghan
Trinidadian and Tobagonian
Family Poverty
Family Poverty Comparison
Afghans
Trinidadians and Tobagonians
8.8%
FAMILY POVERTY
63.5/ 100
METRIC RATING
166th/ 347
METRIC RANK
10.9%
FAMILY POVERTY
0.1/ 100
METRIC RATING
264th/ 347
METRIC RANK
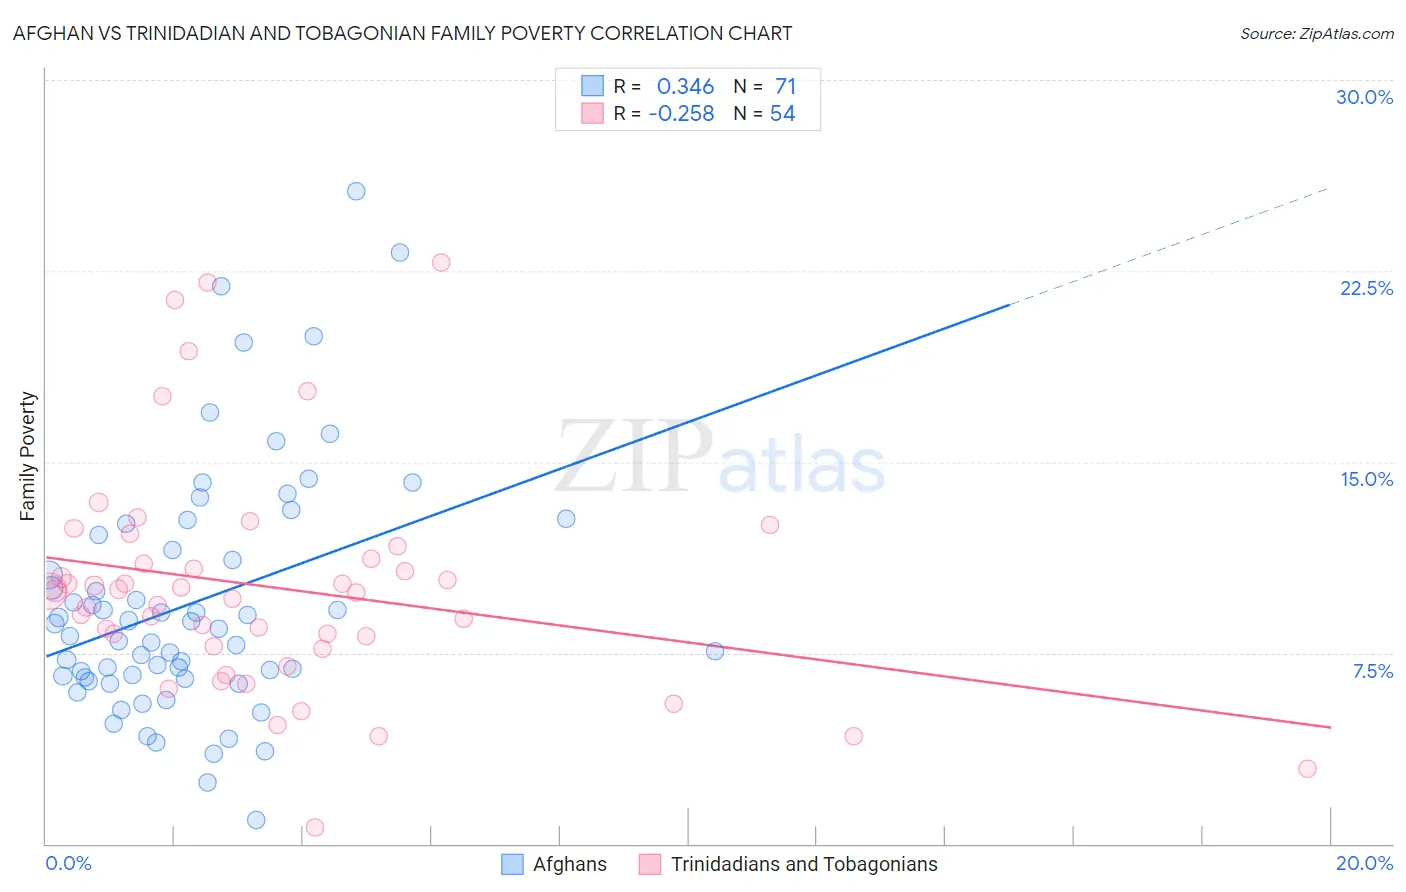
Afghan vs Trinidadian and Tobagonian Family Poverty Correlation Chart
The statistical analysis conducted on geographies consisting of 148,686,157 people shows a mild positive correlation between the proportion of Afghans and poverty level among families in the United States with a correlation coefficient (R) of 0.346 and weighted average of 8.8%. Similarly, the statistical analysis conducted on geographies consisting of 219,444,154 people shows a weak negative correlation between the proportion of Trinidadians and Tobagonians and poverty level among families in the United States with a correlation coefficient (R) of -0.258 and weighted average of 10.9%, a difference of 23.7%.
Family Poverty Correlation Summary
| Measurement | Afghan | Trinidadian and Tobagonian |
| Minimum | 0.91% | 0.64% |
| Maximum | 25.6% | 22.8% |
| Range | 24.7% | 22.2% |
| Mean | 9.5% | 10.1% |
| Median | 8.4% | 9.9% |
| Interquartile 25% (IQ1) | 6.5% | 7.8% |
| Interquartile 75% (IQ3) | 12.1% | 11.2% |
| Interquartile Range (IQR) | 5.6% | 3.5% |
| Standard Deviation (Sample) | 4.8% | 4.5% |
| Standard Deviation (Population) | 4.8% | 4.4% |
Similar Demographics by Family Poverty
Demographics Similar to Afghans by Family Poverty
In terms of family poverty, the demographic groups most similar to Afghans are Immigrants from Ethiopia (8.9%, a difference of 0.14%), Guamanian/Chamorro (8.8%, a difference of 0.18%), Israeli (8.9%, a difference of 0.20%), Celtic (8.8%, a difference of 0.21%), and Pennsylvania German (8.8%, a difference of 0.37%).
| Demographics | Rating | Rank | Family Poverty |
| Peruvians | 68.0 /100 | #159 | Good 8.8% |
| Hungarians | 67.2 /100 | #160 | Good 8.8% |
| Immigrants | Northern Africa | 66.9 /100 | #161 | Good 8.8% |
| Ethiopians | 66.3 /100 | #162 | Good 8.8% |
| Pennsylvania Germans | 66.0 /100 | #163 | Good 8.8% |
| Celtics | 64.9 /100 | #164 | Good 8.8% |
| Guamanians/Chamorros | 64.7 /100 | #165 | Good 8.8% |
| Afghans | 63.5 /100 | #166 | Good 8.8% |
| Immigrants | Ethiopia | 62.5 /100 | #167 | Good 8.9% |
| Israelis | 62.1 /100 | #168 | Good 8.9% |
| Immigrants | Chile | 59.6 /100 | #169 | Average 8.9% |
| Kenyans | 58.2 /100 | #170 | Average 8.9% |
| Lebanese | 57.6 /100 | #171 | Average 8.9% |
| Immigrants | Peru | 57.5 /100 | #172 | Average 8.9% |
| Immigrants | Fiji | 56.4 /100 | #173 | Average 8.9% |
Demographics Similar to Trinidadians and Tobagonians by Family Poverty
In terms of family poverty, the demographic groups most similar to Trinidadians and Tobagonians are Cape Verdean (10.9%, a difference of 0.020%), Immigrants from Trinidad and Tobago (10.9%, a difference of 0.060%), Spanish American Indian (10.9%, a difference of 0.28%), Shoshone (10.9%, a difference of 0.41%), and Bangladeshi (10.9%, a difference of 0.44%).
| Demographics | Rating | Rank | Family Poverty |
| Immigrants | Ghana | 0.2 /100 | #257 | Tragic 10.8% |
| Sub-Saharan Africans | 0.2 /100 | #258 | Tragic 10.9% |
| Mexican American Indians | 0.2 /100 | #259 | Tragic 10.9% |
| Bangladeshis | 0.2 /100 | #260 | Tragic 10.9% |
| Shoshone | 0.2 /100 | #261 | Tragic 10.9% |
| Spanish American Indians | 0.2 /100 | #262 | Tragic 10.9% |
| Cape Verdeans | 0.1 /100 | #263 | Tragic 10.9% |
| Trinidadians and Tobagonians | 0.1 /100 | #264 | Tragic 10.9% |
| Immigrants | Trinidad and Tobago | 0.1 /100 | #265 | Tragic 10.9% |
| Immigrants | El Salvador | 0.1 /100 | #266 | Tragic 11.0% |
| Comanche | 0.1 /100 | #267 | Tragic 11.0% |
| Jamaicans | 0.1 /100 | #268 | Tragic 11.1% |
| Immigrants | Ecuador | 0.1 /100 | #269 | Tragic 11.1% |
| Immigrants | Nicaragua | 0.1 /100 | #270 | Tragic 11.1% |
| Immigrants | Bahamas | 0.1 /100 | #271 | Tragic 11.1% |