Houma vs Trinidadian and Tobagonian Family Poverty
COMPARE
Houma
Trinidadian and Tobagonian
Family Poverty
Family Poverty Comparison
Houma
Trinidadians and Tobagonians
14.6%
FAMILY POVERTY
0.0/ 100
METRIC RATING
334th/ 347
METRIC RANK
10.9%
FAMILY POVERTY
0.1/ 100
METRIC RATING
264th/ 347
METRIC RANK
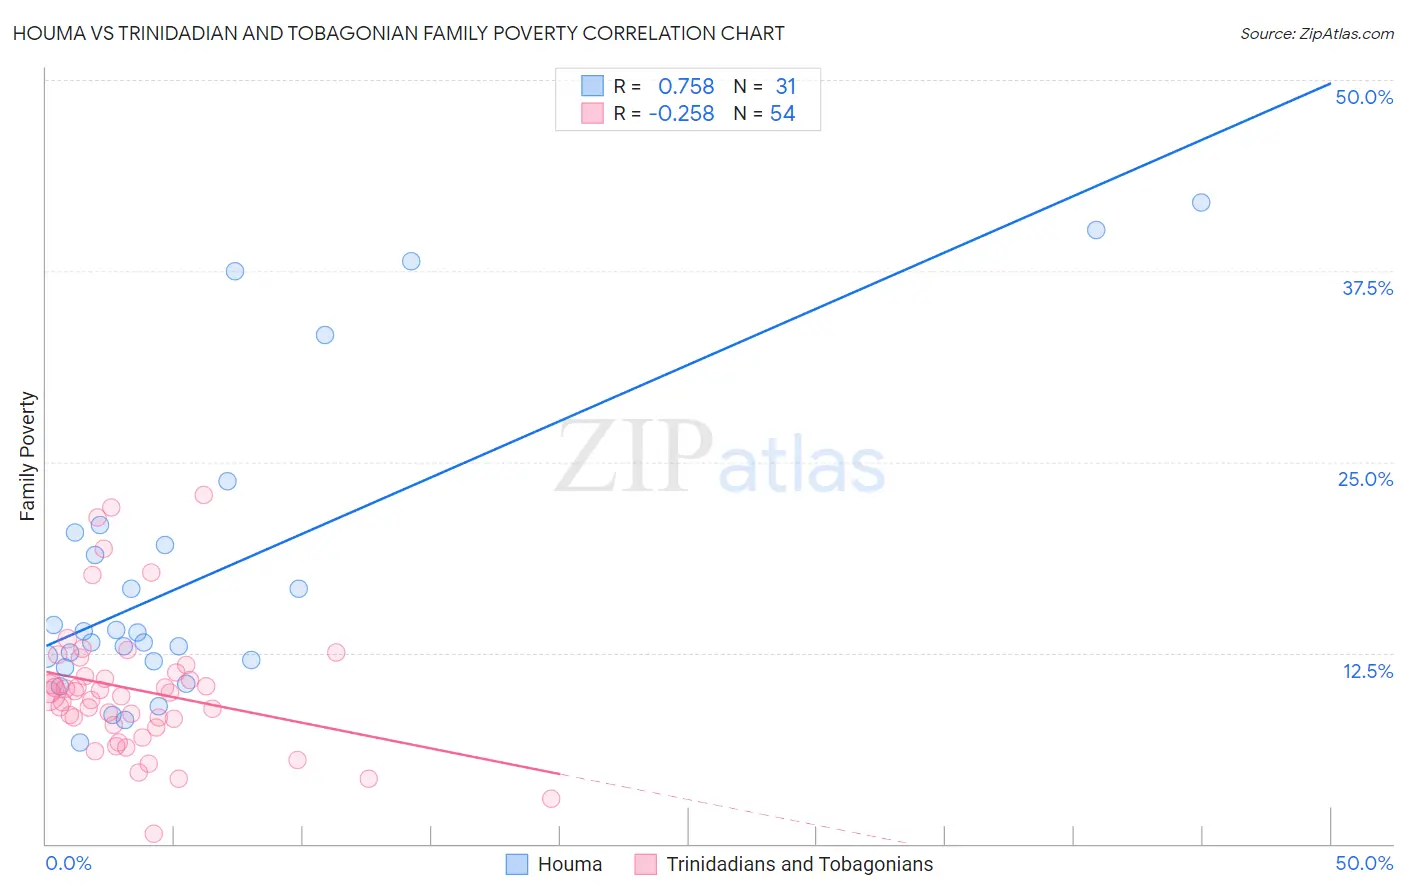
Houma vs Trinidadian and Tobagonian Family Poverty Correlation Chart
The statistical analysis conducted on geographies consisting of 36,784,035 people shows a strong positive correlation between the proportion of Houma and poverty level among families in the United States with a correlation coefficient (R) of 0.758 and weighted average of 14.6%. Similarly, the statistical analysis conducted on geographies consisting of 219,444,154 people shows a weak negative correlation between the proportion of Trinidadians and Tobagonians and poverty level among families in the United States with a correlation coefficient (R) of -0.258 and weighted average of 10.9%, a difference of 33.6%.
Family Poverty Correlation Summary
| Measurement | Houma | Trinidadian and Tobagonian |
| Minimum | 6.6% | 0.64% |
| Maximum | 42.0% | 22.8% |
| Range | 35.4% | 22.2% |
| Mean | 17.7% | 10.1% |
| Median | 13.8% | 9.9% |
| Interquartile 25% (IQ1) | 12.0% | 7.8% |
| Interquartile 75% (IQ3) | 20.4% | 11.2% |
| Interquartile Range (IQR) | 8.4% | 3.5% |
| Standard Deviation (Sample) | 10.0% | 4.5% |
| Standard Deviation (Population) | 9.8% | 4.4% |
Similar Demographics by Family Poverty
Demographics Similar to Houma by Family Poverty
In terms of family poverty, the demographic groups most similar to Houma are Apache (14.7%, a difference of 0.85%), Immigrants from Dominican Republic (14.4%, a difference of 1.3%), Dominican (14.3%, a difference of 1.9%), Cheyenne (14.3%, a difference of 2.4%), and Native/Alaskan (14.3%, a difference of 2.5%).
| Demographics | Rating | Rank | Family Poverty |
| Yakama | 0.0 /100 | #327 | Tragic 13.1% |
| Central American Indians | 0.0 /100 | #328 | Tragic 13.3% |
| Blacks/African Americans | 0.0 /100 | #329 | Tragic 13.3% |
| Natives/Alaskans | 0.0 /100 | #330 | Tragic 14.3% |
| Cheyenne | 0.0 /100 | #331 | Tragic 14.3% |
| Dominicans | 0.0 /100 | #332 | Tragic 14.3% |
| Immigrants | Dominican Republic | 0.0 /100 | #333 | Tragic 14.4% |
| Houma | 0.0 /100 | #334 | Tragic 14.6% |
| Apache | 0.0 /100 | #335 | Tragic 14.7% |
| Sioux | 0.0 /100 | #336 | Tragic 15.9% |
| Hopi | 0.0 /100 | #337 | Tragic 15.9% |
| Crow | 0.0 /100 | #338 | Tragic 16.1% |
| Yuman | 0.0 /100 | #339 | Tragic 16.6% |
| Pueblo | 0.0 /100 | #340 | Tragic 17.0% |
| Lumbee | 0.0 /100 | #341 | Tragic 17.0% |
Demographics Similar to Trinidadians and Tobagonians by Family Poverty
In terms of family poverty, the demographic groups most similar to Trinidadians and Tobagonians are Cape Verdean (10.9%, a difference of 0.020%), Immigrants from Trinidad and Tobago (10.9%, a difference of 0.060%), Spanish American Indian (10.9%, a difference of 0.28%), Shoshone (10.9%, a difference of 0.41%), and Bangladeshi (10.9%, a difference of 0.44%).
| Demographics | Rating | Rank | Family Poverty |
| Immigrants | Ghana | 0.2 /100 | #257 | Tragic 10.8% |
| Sub-Saharan Africans | 0.2 /100 | #258 | Tragic 10.9% |
| Mexican American Indians | 0.2 /100 | #259 | Tragic 10.9% |
| Bangladeshis | 0.2 /100 | #260 | Tragic 10.9% |
| Shoshone | 0.2 /100 | #261 | Tragic 10.9% |
| Spanish American Indians | 0.2 /100 | #262 | Tragic 10.9% |
| Cape Verdeans | 0.1 /100 | #263 | Tragic 10.9% |
| Trinidadians and Tobagonians | 0.1 /100 | #264 | Tragic 10.9% |
| Immigrants | Trinidad and Tobago | 0.1 /100 | #265 | Tragic 10.9% |
| Immigrants | El Salvador | 0.1 /100 | #266 | Tragic 11.0% |
| Comanche | 0.1 /100 | #267 | Tragic 11.0% |
| Jamaicans | 0.1 /100 | #268 | Tragic 11.1% |
| Immigrants | Ecuador | 0.1 /100 | #269 | Tragic 11.1% |
| Immigrants | Nicaragua | 0.1 /100 | #270 | Tragic 11.1% |
| Immigrants | Bahamas | 0.1 /100 | #271 | Tragic 11.1% |