Scottish vs Trinidadian and Tobagonian Family Poverty
COMPARE
Scottish
Trinidadian and Tobagonian
Family Poverty
Family Poverty Comparison
Scottish
Trinidadians and Tobagonians
7.9%
FAMILY POVERTY
97.3/ 100
METRIC RATING
86th/ 347
METRIC RANK
10.9%
FAMILY POVERTY
0.1/ 100
METRIC RATING
264th/ 347
METRIC RANK
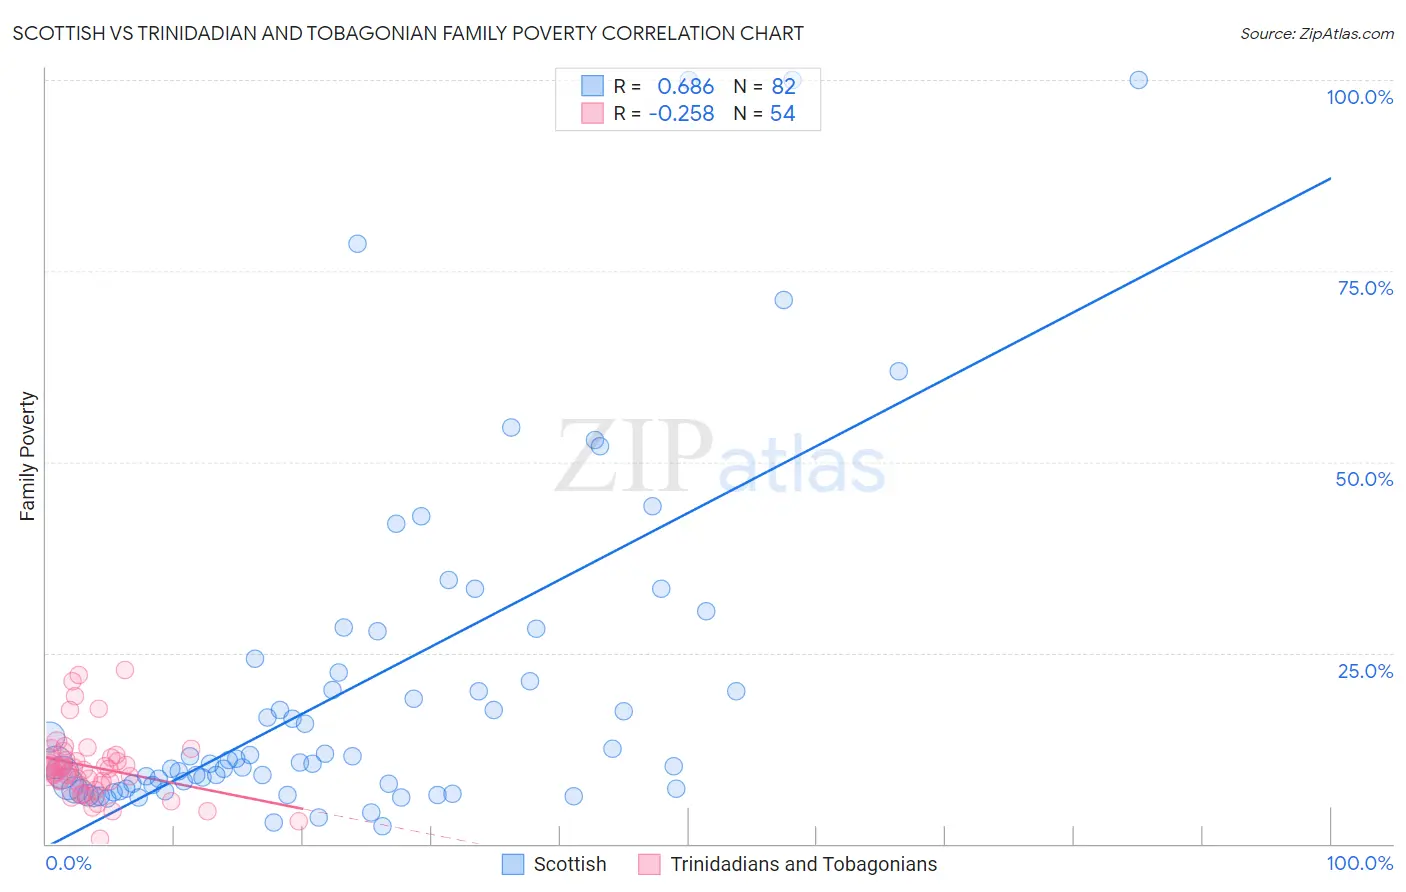
Scottish vs Trinidadian and Tobagonian Family Poverty Correlation Chart
The statistical analysis conducted on geographies consisting of 562,331,846 people shows a significant positive correlation between the proportion of Scottish and poverty level among families in the United States with a correlation coefficient (R) of 0.686 and weighted average of 7.9%. Similarly, the statistical analysis conducted on geographies consisting of 219,444,154 people shows a weak negative correlation between the proportion of Trinidadians and Tobagonians and poverty level among families in the United States with a correlation coefficient (R) of -0.258 and weighted average of 10.9%, a difference of 37.7%.
Family Poverty Correlation Summary
| Measurement | Scottish | Trinidadian and Tobagonian |
| Minimum | 2.3% | 0.64% |
| Maximum | 100.0% | 22.8% |
| Range | 97.7% | 22.2% |
| Mean | 20.4% | 10.1% |
| Median | 10.7% | 9.9% |
| Interquartile 25% (IQ1) | 7.2% | 7.8% |
| Interquartile 75% (IQ3) | 22.4% | 11.2% |
| Interquartile Range (IQR) | 15.2% | 3.5% |
| Standard Deviation (Sample) | 22.2% | 4.5% |
| Standard Deviation (Population) | 22.1% | 4.4% |
Similar Demographics by Family Poverty
Demographics Similar to Scottish by Family Poverty
In terms of family poverty, the demographic groups most similar to Scottish are Immigrants from Asia (7.9%, a difference of 0.040%), Belgian (8.0%, a difference of 0.090%), Serbian (8.0%, a difference of 0.15%), British (7.9%, a difference of 0.29%), and Immigrants from Denmark (8.0%, a difference of 0.30%).
| Demographics | Rating | Rank | Family Poverty |
| Immigrants | Europe | 97.8 /100 | #79 | Exceptional 7.9% |
| English | 97.8 /100 | #80 | Exceptional 7.9% |
| Irish | 97.8 /100 | #81 | Exceptional 7.9% |
| Immigrants | Poland | 97.8 /100 | #82 | Exceptional 7.9% |
| Slovaks | 97.7 /100 | #83 | Exceptional 7.9% |
| British | 97.5 /100 | #84 | Exceptional 7.9% |
| Immigrants | Asia | 97.4 /100 | #85 | Exceptional 7.9% |
| Scottish | 97.3 /100 | #86 | Exceptional 7.9% |
| Belgians | 97.3 /100 | #87 | Exceptional 8.0% |
| Serbians | 97.2 /100 | #88 | Exceptional 8.0% |
| Immigrants | Denmark | 97.1 /100 | #89 | Exceptional 8.0% |
| Immigrants | England | 97.1 /100 | #90 | Exceptional 8.0% |
| Immigrants | Italy | 97.0 /100 | #91 | Exceptional 8.0% |
| Czechoslovakians | 96.8 /100 | #92 | Exceptional 8.0% |
| Tlingit-Haida | 96.7 /100 | #93 | Exceptional 8.0% |
Demographics Similar to Trinidadians and Tobagonians by Family Poverty
In terms of family poverty, the demographic groups most similar to Trinidadians and Tobagonians are Cape Verdean (10.9%, a difference of 0.020%), Immigrants from Trinidad and Tobago (10.9%, a difference of 0.060%), Spanish American Indian (10.9%, a difference of 0.28%), Shoshone (10.9%, a difference of 0.41%), and Bangladeshi (10.9%, a difference of 0.44%).
| Demographics | Rating | Rank | Family Poverty |
| Immigrants | Ghana | 0.2 /100 | #257 | Tragic 10.8% |
| Sub-Saharan Africans | 0.2 /100 | #258 | Tragic 10.9% |
| Mexican American Indians | 0.2 /100 | #259 | Tragic 10.9% |
| Bangladeshis | 0.2 /100 | #260 | Tragic 10.9% |
| Shoshone | 0.2 /100 | #261 | Tragic 10.9% |
| Spanish American Indians | 0.2 /100 | #262 | Tragic 10.9% |
| Cape Verdeans | 0.1 /100 | #263 | Tragic 10.9% |
| Trinidadians and Tobagonians | 0.1 /100 | #264 | Tragic 10.9% |
| Immigrants | Trinidad and Tobago | 0.1 /100 | #265 | Tragic 10.9% |
| Immigrants | El Salvador | 0.1 /100 | #266 | Tragic 11.0% |
| Comanche | 0.1 /100 | #267 | Tragic 11.0% |
| Jamaicans | 0.1 /100 | #268 | Tragic 11.1% |
| Immigrants | Ecuador | 0.1 /100 | #269 | Tragic 11.1% |
| Immigrants | Nicaragua | 0.1 /100 | #270 | Tragic 11.1% |
| Immigrants | Bahamas | 0.1 /100 | #271 | Tragic 11.1% |