Immigrants from Micronesia vs Immigrants from Senegal Married-Couple Family Poverty
COMPARE
Immigrants from Micronesia
Immigrants from Senegal
Married-Couple Family Poverty
Married-Couple Family Poverty Comparison
Immigrants from Micronesia
Immigrants from Senegal
5.5%
MARRIED-COUPLE FAMILY POVERTY
14.4/ 100
METRIC RATING
210th/ 347
METRIC RANK
6.1%
MARRIED-COUPLE FAMILY POVERTY
0.3/ 100
METRIC RATING
263rd/ 347
METRIC RANK
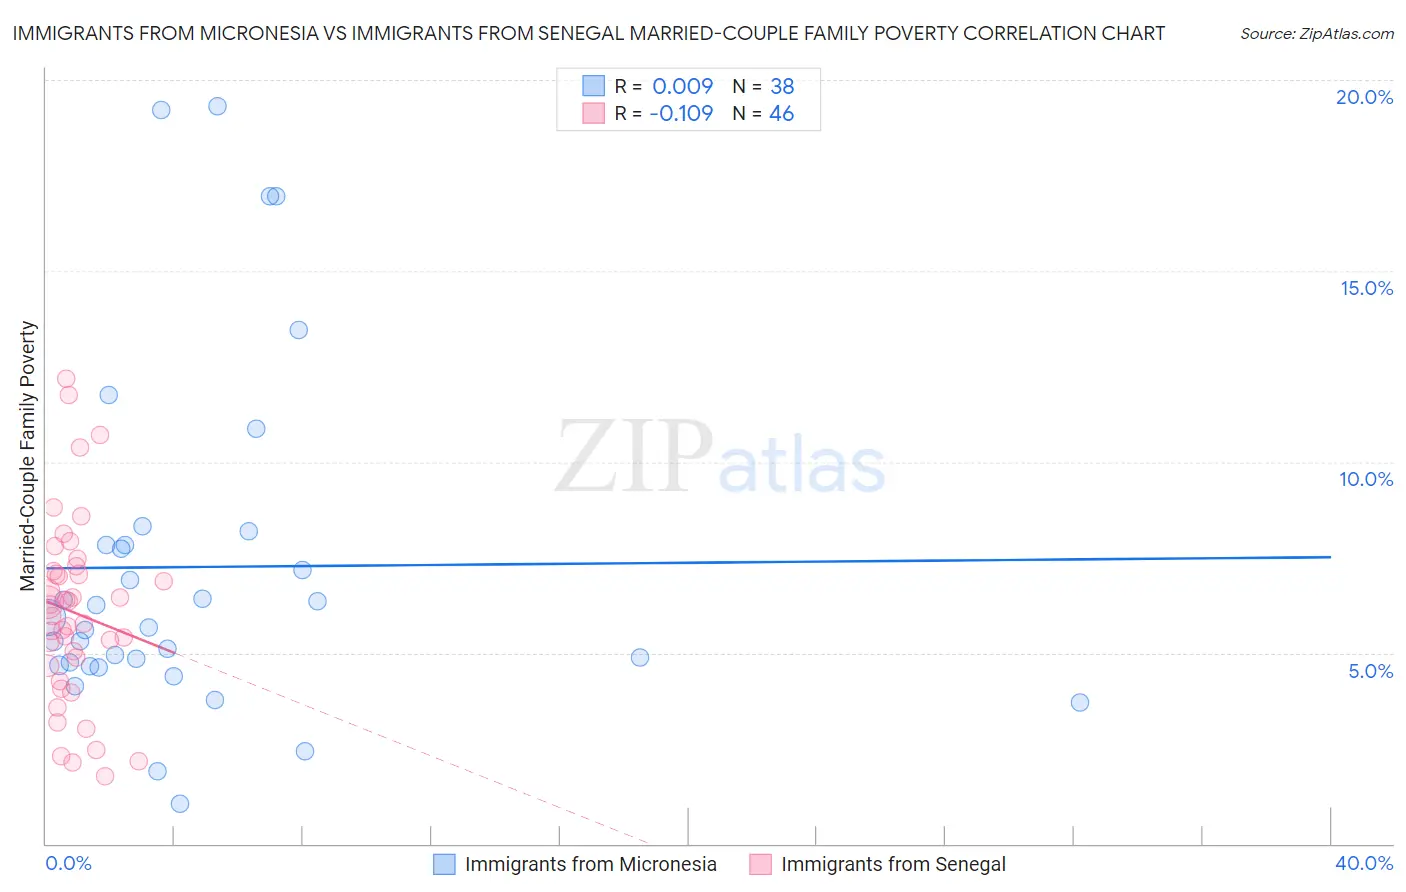
Immigrants from Micronesia vs Immigrants from Senegal Married-Couple Family Poverty Correlation Chart
The statistical analysis conducted on geographies consisting of 61,488,987 people shows no correlation between the proportion of Immigrants from Micronesia and poverty level among married-couple families in the United States with a correlation coefficient (R) of 0.009 and weighted average of 5.5%. Similarly, the statistical analysis conducted on geographies consisting of 89,915,851 people shows a poor negative correlation between the proportion of Immigrants from Senegal and poverty level among married-couple families in the United States with a correlation coefficient (R) of -0.109 and weighted average of 6.1%, a difference of 11.6%.
Married-Couple Family Poverty Correlation Summary
| Measurement | Immigrants from Micronesia | Immigrants from Senegal |
| Minimum | 1.0% | 1.8% |
| Maximum | 19.3% | 12.2% |
| Range | 18.3% | 10.4% |
| Mean | 7.2% | 6.1% |
| Median | 5.8% | 6.1% |
| Interquartile 25% (IQ1) | 4.7% | 4.7% |
| Interquartile 75% (IQ3) | 7.8% | 7.1% |
| Interquartile Range (IQR) | 3.2% | 2.5% |
| Standard Deviation (Sample) | 4.5% | 2.4% |
| Standard Deviation (Population) | 4.4% | 2.4% |
Similar Demographics by Married-Couple Family Poverty
Demographics Similar to Immigrants from Micronesia by Married-Couple Family Poverty
In terms of married-couple family poverty, the demographic groups most similar to Immigrants from Micronesia are Nigerian (5.5%, a difference of 0.020%), Immigrants from Thailand (5.5%, a difference of 0.090%), Immigrants from Syria (5.5%, a difference of 0.21%), Immigrants from Liberia (5.5%, a difference of 0.26%), and Iroquois (5.5%, a difference of 0.31%).
| Demographics | Rating | Rank | Married-Couple Family Poverty |
| Immigrants | Peru | 21.8 /100 | #203 | Fair 5.4% |
| Immigrants | Costa Rica | 19.4 /100 | #204 | Poor 5.4% |
| Chippewa | 18.9 /100 | #205 | Poor 5.4% |
| Osage | 18.4 /100 | #206 | Poor 5.4% |
| Immigrants | Africa | 17.6 /100 | #207 | Poor 5.5% |
| French American Indians | 16.1 /100 | #208 | Poor 5.5% |
| Immigrants | Syria | 15.4 /100 | #209 | Poor 5.5% |
| Immigrants | Micronesia | 14.4 /100 | #210 | Poor 5.5% |
| Nigerians | 14.3 /100 | #211 | Poor 5.5% |
| Immigrants | Thailand | 14.0 /100 | #212 | Poor 5.5% |
| Immigrants | Liberia | 13.3 /100 | #213 | Poor 5.5% |
| Iroquois | 13.1 /100 | #214 | Poor 5.5% |
| Armenians | 12.8 /100 | #215 | Poor 5.5% |
| Potawatomi | 12.4 /100 | #216 | Poor 5.5% |
| Immigrants | Nigeria | 11.3 /100 | #217 | Poor 5.5% |
Demographics Similar to Immigrants from Senegal by Married-Couple Family Poverty
In terms of married-couple family poverty, the demographic groups most similar to Immigrants from Senegal are Immigrants from Congo (6.1%, a difference of 0.22%), Shoshone (6.1%, a difference of 0.39%), Senegalese (6.1%, a difference of 0.60%), Blackfeet (6.2%, a difference of 0.66%), and Creek (6.2%, a difference of 0.73%).
| Demographics | Rating | Rank | Married-Couple Family Poverty |
| Bangladeshis | 0.5 /100 | #256 | Tragic 6.0% |
| Immigrants | Burma/Myanmar | 0.5 /100 | #257 | Tragic 6.0% |
| Immigrants | Immigrants | 0.5 /100 | #258 | Tragic 6.0% |
| Alaskan Athabascans | 0.4 /100 | #259 | Tragic 6.1% |
| Jamaicans | 0.3 /100 | #260 | Tragic 6.1% |
| Senegalese | 0.3 /100 | #261 | Tragic 6.1% |
| Shoshone | 0.3 /100 | #262 | Tragic 6.1% |
| Immigrants | Senegal | 0.3 /100 | #263 | Tragic 6.1% |
| Immigrants | Congo | 0.2 /100 | #264 | Tragic 6.1% |
| Blackfeet | 0.2 /100 | #265 | Tragic 6.2% |
| Creek | 0.2 /100 | #266 | Tragic 6.2% |
| Spanish Americans | 0.2 /100 | #267 | Tragic 6.2% |
| Alaska Natives | 0.2 /100 | #268 | Tragic 6.2% |
| Immigrants | West Indies | 0.1 /100 | #269 | Tragic 6.2% |
| Immigrants | Jamaica | 0.1 /100 | #270 | Tragic 6.2% |