Salvadoran vs Choctaw Single Female Poverty
COMPARE
Salvadoran
Choctaw
Single Female Poverty
Single Female Poverty Comparison
Salvadorans
Choctaw
21.9%
SINGLE FEMALE POVERTY
5.5/ 100
METRIC RATING
228th/ 347
METRIC RANK
27.2%
SINGLE FEMALE POVERTY
0.0/ 100
METRIC RATING
325th/ 347
METRIC RANK
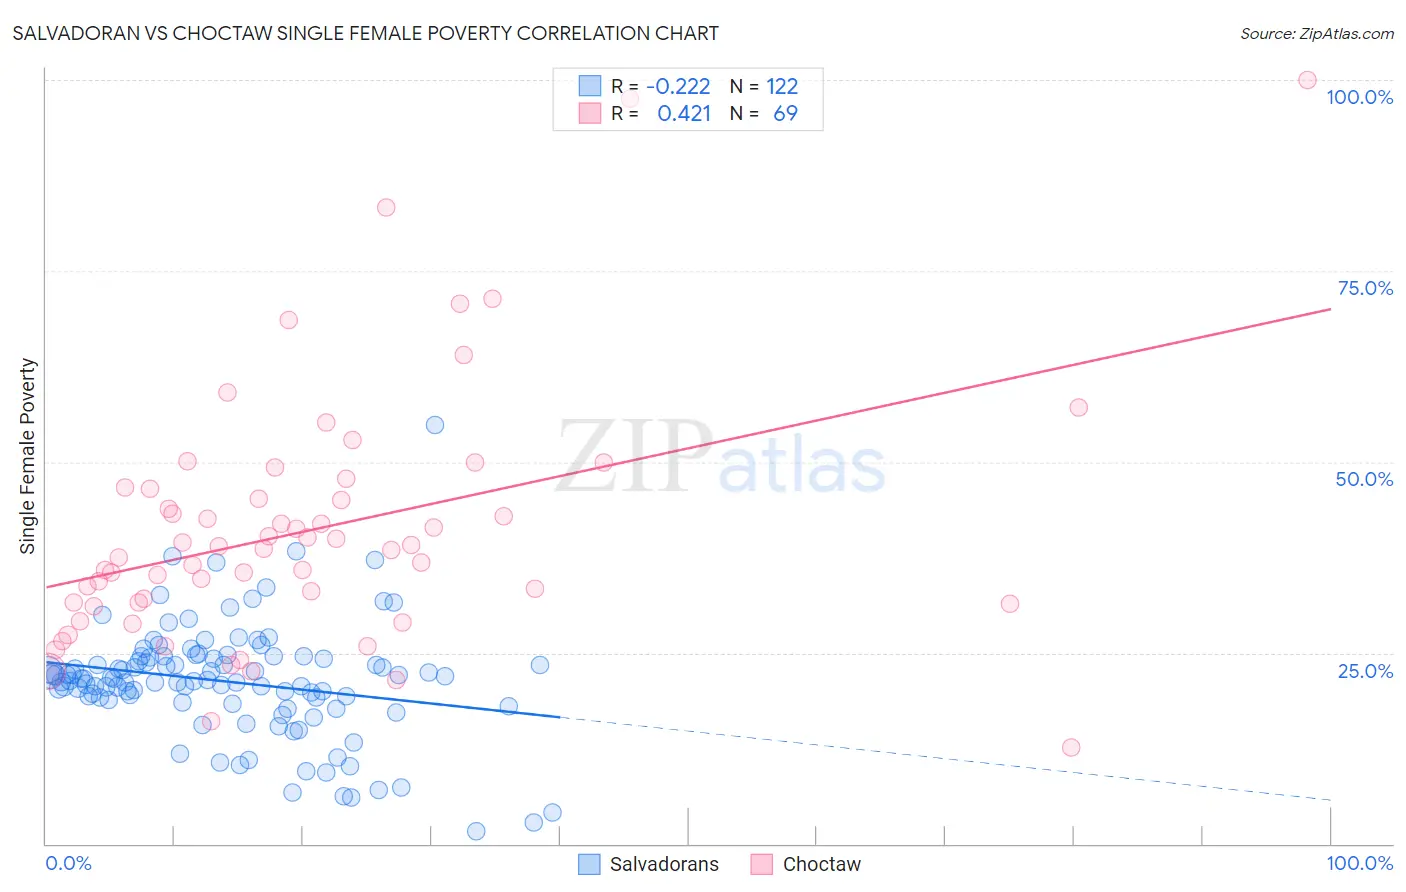
Salvadoran vs Choctaw Single Female Poverty Correlation Chart
The statistical analysis conducted on geographies consisting of 394,529,574 people shows a weak negative correlation between the proportion of Salvadorans and poverty level among single females in the United States with a correlation coefficient (R) of -0.222 and weighted average of 21.9%. Similarly, the statistical analysis conducted on geographies consisting of 267,534,581 people shows a moderate positive correlation between the proportion of Choctaw and poverty level among single females in the United States with a correlation coefficient (R) of 0.421 and weighted average of 27.2%, a difference of 24.0%.
Single Female Poverty Correlation Summary
| Measurement | Salvadoran | Choctaw |
| Minimum | 1.6% | 12.6% |
| Maximum | 54.8% | 100.0% |
| Range | 53.2% | 87.4% |
| Mean | 21.2% | 41.2% |
| Median | 21.5% | 38.6% |
| Interquartile 25% (IQ1) | 18.8% | 31.5% |
| Interquartile 75% (IQ3) | 24.3% | 46.6% |
| Interquartile Range (IQR) | 5.5% | 15.1% |
| Standard Deviation (Sample) | 7.6% | 16.5% |
| Standard Deviation (Population) | 7.5% | 16.4% |
Similar Demographics by Single Female Poverty
Demographics Similar to Salvadorans by Single Female Poverty
In terms of single female poverty, the demographic groups most similar to Salvadorans are Tlingit-Haida (21.9%, a difference of 0.030%), Immigrants from Western Africa (22.0%, a difference of 0.050%), Immigrants from Portugal (21.9%, a difference of 0.10%), Immigrants from Ghana (21.9%, a difference of 0.10%), and Welsh (22.0%, a difference of 0.14%).
| Demographics | Rating | Rank | Single Female Poverty |
| Immigrants | Grenada | 8.0 /100 | #221 | Tragic 21.8% |
| Immigrants | Eritrea | 7.9 /100 | #222 | Tragic 21.8% |
| Scottish | 7.3 /100 | #223 | Tragic 21.8% |
| Barbadians | 7.2 /100 | #224 | Tragic 21.8% |
| English | 6.4 /100 | #225 | Tragic 21.9% |
| Immigrants | Portugal | 5.8 /100 | #226 | Tragic 21.9% |
| Immigrants | Ghana | 5.8 /100 | #227 | Tragic 21.9% |
| Salvadorans | 5.5 /100 | #228 | Tragic 21.9% |
| Tlingit-Haida | 5.4 /100 | #229 | Tragic 21.9% |
| Immigrants | Western Africa | 5.3 /100 | #230 | Tragic 22.0% |
| Welsh | 5.0 /100 | #231 | Tragic 22.0% |
| Immigrants | Thailand | 5.0 /100 | #232 | Tragic 22.0% |
| Spaniards | 4.7 /100 | #233 | Tragic 22.0% |
| Spanish | 4.7 /100 | #234 | Tragic 22.0% |
| Dutch | 4.6 /100 | #235 | Tragic 22.0% |
Demographics Similar to Choctaw by Single Female Poverty
In terms of single female poverty, the demographic groups most similar to Choctaw are Creek (27.4%, a difference of 0.88%), Dutch West Indian (27.5%, a difference of 0.96%), Kiowa (26.9%, a difference of 0.98%), Chippewa (26.8%, a difference of 1.4%), and Seminole (26.8%, a difference of 1.5%).
| Demographics | Rating | Rank | Single Female Poverty |
| Chickasaw | 0.0 /100 | #318 | Tragic 26.3% |
| Blacks/African Americans | 0.0 /100 | #319 | Tragic 26.4% |
| Arapaho | 0.0 /100 | #320 | Tragic 26.4% |
| Yup'ik | 0.0 /100 | #321 | Tragic 26.6% |
| Seminole | 0.0 /100 | #322 | Tragic 26.8% |
| Chippewa | 0.0 /100 | #323 | Tragic 26.8% |
| Kiowa | 0.0 /100 | #324 | Tragic 26.9% |
| Choctaw | 0.0 /100 | #325 | Tragic 27.2% |
| Creek | 0.0 /100 | #326 | Tragic 27.4% |
| Dutch West Indians | 0.0 /100 | #327 | Tragic 27.5% |
| Apache | 0.0 /100 | #328 | Tragic 27.7% |
| Menominee | 0.0 /100 | #329 | Tragic 27.8% |
| Hopi | 0.0 /100 | #330 | Tragic 28.0% |
| Natives/Alaskans | 0.0 /100 | #331 | Tragic 28.2% |
| Yakama | 0.0 /100 | #332 | Tragic 28.3% |