Salvadoran vs Albanian Single Female Poverty

COMPARE

Salvadoran
Race
Ancestry
AfghanAfricanAlaska NativeAlaskan AthabascanAleutAlsatianAmericanApacheArabArapahoArgentineanArmenianAssyrian/Chaldean/SyriacAustralianAustrianBahamianBangladeshiBarbadianBasqueBelgianBelizeanBermudanBhutaneseBlackfeetBolivianBrazilianBritishBritish West IndianBulgarianBurmeseCajunCambodianCanadianCape VerdeanCarpatho RusynCelticCentral AmericanCentral American IndianCherokeeCheyenneChickasawChileanChineseChippewaChoctawColombianColvilleComancheCosta RicanCreeCreekCroatianCrowCubanCypriotCzechCzechoslovakianDanishDelawareDominicanDutchDutch West IndianEastern EuropeanEcuadorianEgyptianEnglishEstonianEthiopianEuropeanFijianFilipinoFinnishFrenchFrench American IndianFrench CanadianGermanGerman RussianGhanaianGreekGuamanian/ChamorroGuatemalanGuyaneseHaitianHmongHonduranHopiHoumaHungarianIcelanderIndian (Asian)IndonesianInupiatIranianIraqiIrishIroquoisIsraeliItalianJamaicanJapaneseJordanianKenyanKiowaKoreanLaotianLatvianLebaneseLiberianLithuanianLumbeeLuxembourgerMacedonianMalaysianMalteseMarshalleseMenomineeMexicanMexican American IndianMongolianMoroccanNative HawaiianNavajoNepaleseNew ZealanderNicaraguanNigerianNorthern EuropeanNorwegianOkinawanOsageOttawaPaiutePakistaniPalestinianPanamanianParaguayanPennsylvania GermanPeruvianPimaPolishPortuguesePotawatomiPuebloPuerto RicanPuget Sound SalishRomanianRussianSalvadoranSamoanScandinavianScotch-IrishScottishSeminoleSenegaleseSerbianShoshoneSierra LeoneanSiouxSlavicSlovakSloveneSomaliSouth AfricanSouth AmericanSouth American IndianSoviet UnionSpaniardSpanishSpanish AmericanSpanish American IndianSri LankanSubsaharan AfricanSudaneseSwedishSwissSyrianTaiwaneseThaiTlingit-HaidaTohono O'OdhamTonganTrinidadian and TobagonianTsimshianTurkishU.S. Virgin IslanderUgandanUkrainianUruguayanUteVenezuelanVietnameseWelshWest IndianYakamaYaquiYugoslavianYumanYup'ikZimbabwean
Immigration
NonimmigrantsImmigrantsAfghanistanAfricaAlbaniaArgentinaArmeniaAsiaAustraliaAustriaBahamasBangladeshBarbadosBelarusBelgiumBelizeBoliviaBosnia and HerzegovinaBrazilBulgariaBurma/MyanmarCabo VerdeCambodiaCameroonCanadaCaribbeanCentral AmericaChileChinaColombiaCongoCosta RicaCroatiaCubaCzechoslovakiaDenmarkDominicaDominican RepublicEastern AfricaEastern AsiaEastern EuropeEcuadorEgyptEl SalvadorEnglandEritreaEthiopiaEuropeFijiFranceGermanyGhanaGreeceGrenadaGuatemalaGuyanaHaitiHondurasHong KongHungaryIndiaIndonesiaIranIraqIrelandIsraelItalyJamaicaJapanJordanKazakhstanKenyaKoreaKuwaitLaosLatin AmericaLatviaLebanonLiberiaLithuaniaMalaysiaMexicoMicronesiaMiddle AfricaMoldovaMoroccoNepalNetherlandsNicaraguaNigeriaNorth AmericaNorth MacedoniaNorthern AfricaNorthern EuropeNorwayOceaniaPakistanPanamaPeruPhilippinesPolandPortugalRomaniaRussiaSaudi ArabiaScotlandSenegalSerbiaSierra LeoneSingaporeSomaliaSouth AfricaSouth AmericaSouth Central AsiaSouth Eastern AsiaSouthern EuropeSpainSri LankaSt. Vincent and the GrenadinesSudanSwedenSwitzerlandSyriaTaiwanThailandTrinidad and TobagoTurkeyUgandaUkraineUruguayUzbekistanVenezuelaVietnamWest IndiesWestern AfricaWestern AsiaWestern EuropeYemenZaireZimbabweAzores
Albanian
Race
Ancestry
AfghanAfricanAlaska NativeAlaskan AthabascanAlbanianAleutAlsatianAmericanApacheArabArapahoArgentineanArmenianAssyrian/Chaldean/SyriacAustralianAustrianBahamianBangladeshiBarbadianBasqueBelgianBelizeanBermudanBhutaneseBlackfeetBolivianBrazilianBritishBritish West IndianBulgarianBurmeseCajunCambodianCanadianCape VerdeanCarpatho RusynCelticCentral AmericanCentral American IndianCherokeeCheyenneChickasawChileanChineseChippewaChoctawColombianColvilleComancheCosta RicanCreeCreekCroatianCrowCubanCypriotCzechCzechoslovakianDanishDelawareDominicanDutchDutch West IndianEastern EuropeanEcuadorianEgyptianEnglishEstonianEthiopianEuropeanFijianFilipinoFinnishFrenchFrench American IndianFrench CanadianGermanGerman RussianGhanaianGreekGuamanian/ChamorroGuatemalanGuyaneseHaitianHmongHonduranHopiHoumaHungarianIcelanderIndian (Asian)IndonesianInupiatIranianIraqiIrishIroquoisIsraeliItalianJamaicanJapaneseJordanianKenyanKiowaKoreanLaotianLatvianLebaneseLiberianLithuanianLumbeeLuxembourgerMacedonianMalaysianMalteseMarshalleseMenomineeMexicanMexican American IndianMongolianMoroccanNative HawaiianNavajoNepaleseNew ZealanderNicaraguanNigerianNorthern EuropeanNorwegianOkinawanOsageOttawaPaiutePakistaniPalestinianPanamanianParaguayanPennsylvania GermanPeruvianPimaPolishPortuguesePotawatomiPuebloPuerto RicanPuget Sound SalishRomanianRussianSamoanScandinavianScotch-IrishScottishSeminoleSenegaleseSerbianShoshoneSierra LeoneanSiouxSlavicSlovakSloveneSomaliSouth AfricanSouth AmericanSouth American IndianSoviet UnionSpaniardSpanishSpanish AmericanSpanish American IndianSri LankanSubsaharan AfricanSudaneseSwedishSwissSyrianTaiwaneseThaiTlingit-HaidaTohono O'OdhamTonganTrinidadian and TobagonianTsimshianTurkishU.S. Virgin IslanderUgandanUkrainianUruguayanUteVenezuelanVietnameseWelshWest IndianYakamaYaquiYugoslavianYumanYup'ikZimbabwean
Immigration
NonimmigrantsImmigrantsAfghanistanAfricaAlbaniaArgentinaArmeniaAsiaAustraliaAustriaBahamasBangladeshBarbadosBelarusBelgiumBelizeBoliviaBosnia and HerzegovinaBrazilBulgariaBurma/MyanmarCabo VerdeCambodiaCameroonCanadaCaribbeanCentral AmericaChileChinaColombiaCongoCosta RicaCroatiaCubaCzechoslovakiaDenmarkDominicaDominican RepublicEastern AfricaEastern AsiaEastern EuropeEcuadorEgyptEl SalvadorEnglandEritreaEthiopiaEuropeFijiFranceGermanyGhanaGreeceGrenadaGuatemalaGuyanaHaitiHondurasHong KongHungaryIndiaIndonesiaIranIraqIrelandIsraelItalyJamaicaJapanJordanKazakhstanKenyaKoreaKuwaitLaosLatin AmericaLatviaLebanonLiberiaLithuaniaMalaysiaMexicoMicronesiaMiddle AfricaMoldovaMoroccoNepalNetherlandsNicaraguaNigeriaNorth AmericaNorth MacedoniaNorthern AfricaNorthern EuropeNorwayOceaniaPakistanPanamaPeruPhilippinesPolandPortugalRomaniaRussiaSaudi ArabiaScotlandSenegalSerbiaSierra LeoneSingaporeSomaliaSouth AfricaSouth AmericaSouth Central AsiaSouth Eastern AsiaSouthern EuropeSpainSri LankaSt. Vincent and the GrenadinesSudanSwedenSwitzerlandSyriaTaiwanThailandTrinidad and TobagoTurkeyUgandaUkraineUruguayUzbekistanVenezuelaVietnamWest IndiesWestern AfricaWestern AsiaWestern EuropeYemenZaireZimbabweAzores
Single Female Poverty
Income
Poverty
Unemployment
Labor Participation
Family Structure
Vehicle Availability
Education Level
Disability

Single Female Poverty Comparison

Salvadorans

Albanians

Tragic
Exceptional
21.9%
SINGLE FEMALE POVERTY
5.5/ 100
METRIC RATING
228th/ 347
METRIC RANK
19.4%
SINGLE FEMALE POVERTY
99.3/ 100
METRIC RATING
78th/ 347
METRIC RANK

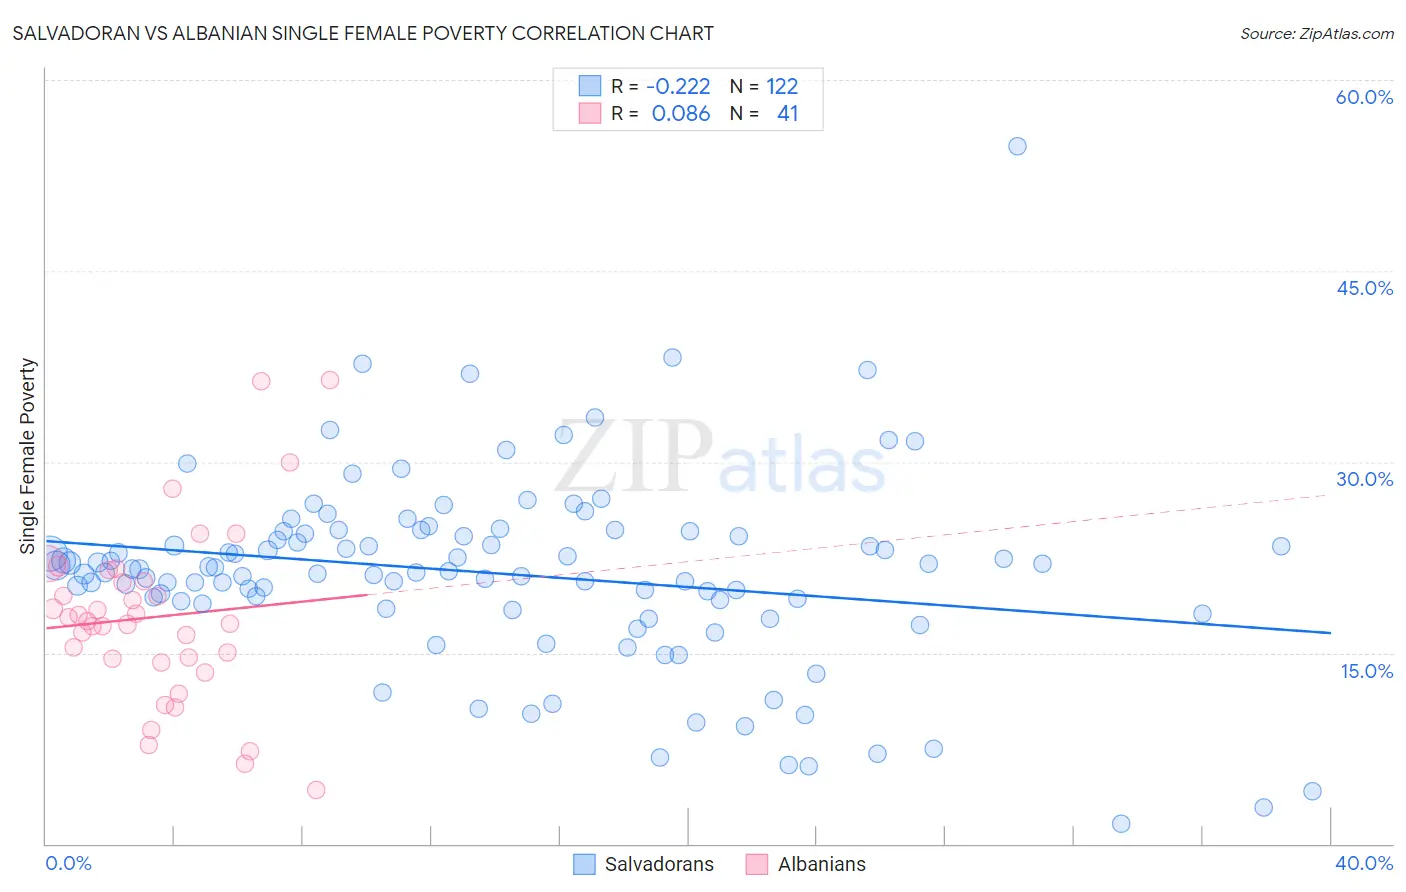
Salvadoran vs Albanian Single Female Poverty Correlation Chart

The statistical analysis conducted on geographies consisting of 394,529,574 people shows a weak negative correlation between the proportion of Salvadorans and poverty level among single females in the United States with a correlation coefficient (R) of -0.222 and weighted average of 21.9%. Similarly, the statistical analysis conducted on geographies consisting of 190,945,474 people shows a slight positive correlation between the proportion of Albanians and poverty level among single females in the United States with a correlation coefficient (R) of 0.086 and weighted average of 19.4%, a difference of 13.1%.
Salvadoran vs Albanian Single Female Poverty

Single Female Poverty Correlation Summary

MeasurementSalvadoranAlbanian
Minimum1.6%4.3%
Maximum54.8%36.5%
Range53.2%32.2%
Mean21.2%17.8%
Median21.5%17.5%
Interquartile 25% (IQ1)18.8%14.4%
Interquartile 75% (IQ3)24.3%21.1%
Interquartile Range (IQR)5.5%6.7%
Standard Deviation (Sample)7.6%6.9%
Standard Deviation (Population)7.5%6.9%

Similar Demographics by Single Female Poverty

Demographics Similar to Salvadorans by Single Female Poverty

In terms of single female poverty, the demographic groups most similar to Salvadorans are Tlingit-Haida (21.9%, a difference of 0.030%), Immigrants from Western Africa (22.0%, a difference of 0.050%), Immigrants from Portugal (21.9%, a difference of 0.10%), Immigrants from Ghana (21.9%, a difference of 0.10%), and Welsh (22.0%, a difference of 0.14%).
DemographicsRating | RankSingle Female Poverty
Immigrants | Grenada
8.0
/100
|
#221
Tragic
21.8%
Immigrants | Eritrea
7.9
/100
|
#222
Tragic
21.8%
Scottish
7.3
/100
|
#223
Tragic
21.8%
Barbadians
7.2
/100
|
#224
Tragic
21.8%
English
6.4
/100
|
#225
Tragic
21.9%
Immigrants | Portugal
5.8
/100
|
#226
Tragic
21.9%
Immigrants | Ghana
5.8
/100
|
#227
Tragic
21.9%
Salvadorans
5.5
/100
|
#228
Tragic
21.9%
Tlingit-Haida
5.4
/100
|
#229
Tragic
21.9%
Immigrants | Western Africa
5.3
/100
|
#230
Tragic
22.0%
Welsh
5.0
/100
|
#231
Tragic
22.0%
Immigrants | Thailand
5.0
/100
|
#232
Tragic
22.0%
Spaniards
4.7
/100
|
#233
Tragic
22.0%
Spanish
4.7
/100
|
#234
Tragic
22.0%
Dutch
4.6
/100
|
#235
Tragic
22.0%

Demographics Similar to Albanians by Single Female Poverty

In terms of single female poverty, the demographic groups most similar to Albanians are Immigrants from Sierra Leone (19.4%, a difference of 0.020%), Immigrants from Australia (19.4%, a difference of 0.060%), Immigrants from Russia (19.4%, a difference of 0.070%), Immigrants from Scotland (19.4%, a difference of 0.080%), and Immigrants from Malaysia (19.4%, a difference of 0.090%).
DemographicsRating | RankSingle Female Poverty
Immigrants | South Eastern Asia
99.4
/100
|
#71
Exceptional
19.3%
Immigrants | Latvia
99.4
/100
|
#72
Exceptional
19.3%
Immigrants | Peru
99.4
/100
|
#73
Exceptional
19.3%
Immigrants | Belarus
99.4
/100
|
#74
Exceptional
19.3%
Immigrants | Turkey
99.4
/100
|
#75
Exceptional
19.4%
Peruvians
99.4
/100
|
#76
Exceptional
19.4%
Immigrants | Russia
99.3
/100
|
#77
Exceptional
19.4%
Albanians
99.3
/100
|
#78
Exceptional
19.4%
Immigrants | Sierra Leone
99.3
/100
|
#79
Exceptional
19.4%
Immigrants | Australia
99.3
/100
|
#80
Exceptional
19.4%
Immigrants | Scotland
99.2
/100
|
#81
Exceptional
19.4%
Immigrants | Malaysia
99.2
/100
|
#82
Exceptional
19.4%
Taiwanese
99.2
/100
|
#83
Exceptional
19.4%
Immigrants | Sweden
99.2
/100
|
#84
Exceptional
19.4%
Immigrants | Albania
99.2
/100
|
#85
Exceptional
19.4%