Salvadoran vs Immigrants from Chile Single Female Poverty
COMPARE
Salvadoran
Immigrants from Chile
Single Female Poverty
Single Female Poverty Comparison
Salvadorans
Immigrants from Chile
21.9%
SINGLE FEMALE POVERTY
5.5/ 100
METRIC RATING
228th/ 347
METRIC RANK
20.1%
SINGLE FEMALE POVERTY
94.3/ 100
METRIC RATING
124th/ 347
METRIC RANK
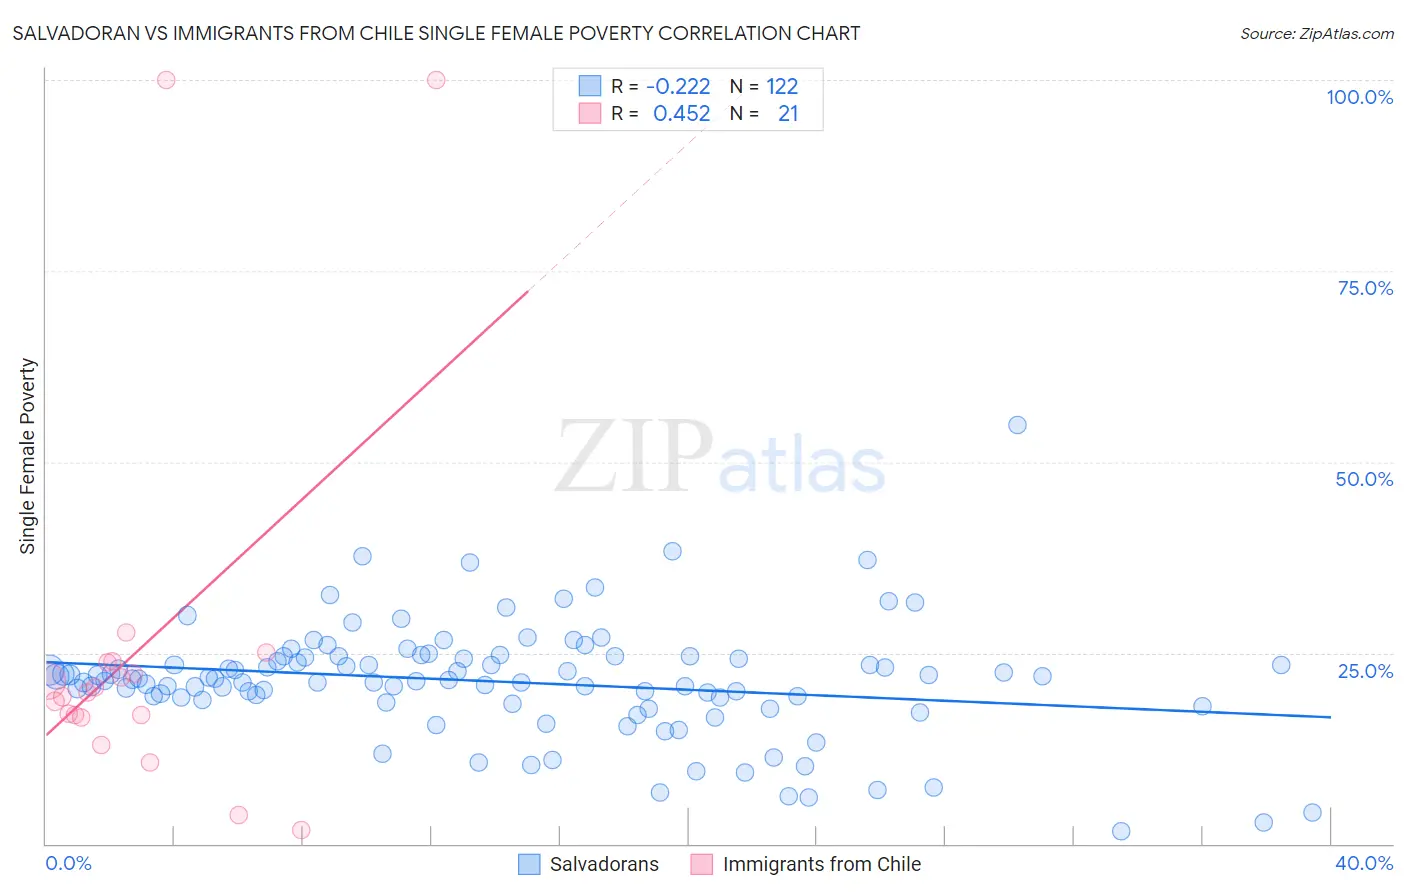
Salvadoran vs Immigrants from Chile Single Female Poverty Correlation Chart
The statistical analysis conducted on geographies consisting of 394,529,574 people shows a weak negative correlation between the proportion of Salvadorans and poverty level among single females in the United States with a correlation coefficient (R) of -0.222 and weighted average of 21.9%. Similarly, the statistical analysis conducted on geographies consisting of 216,927,645 people shows a moderate positive correlation between the proportion of Immigrants from Chile and poverty level among single females in the United States with a correlation coefficient (R) of 0.452 and weighted average of 20.1%, a difference of 9.2%.
Single Female Poverty Correlation Summary
| Measurement | Salvadoran | Immigrants from Chile |
| Minimum | 1.6% | 1.8% |
| Maximum | 54.8% | 100.0% |
| Range | 53.2% | 98.2% |
| Mean | 21.2% | 25.7% |
| Median | 21.5% | 19.7% |
| Interquartile 25% (IQ1) | 18.8% | 16.7% |
| Interquartile 75% (IQ3) | 24.3% | 23.8% |
| Interquartile Range (IQR) | 5.5% | 7.1% |
| Standard Deviation (Sample) | 7.6% | 25.5% |
| Standard Deviation (Population) | 7.5% | 24.9% |
Similar Demographics by Single Female Poverty
Demographics Similar to Salvadorans by Single Female Poverty
In terms of single female poverty, the demographic groups most similar to Salvadorans are Tlingit-Haida (21.9%, a difference of 0.030%), Immigrants from Western Africa (22.0%, a difference of 0.050%), Immigrants from Portugal (21.9%, a difference of 0.10%), Immigrants from Ghana (21.9%, a difference of 0.10%), and Welsh (22.0%, a difference of 0.14%).
| Demographics | Rating | Rank | Single Female Poverty |
| Immigrants | Grenada | 8.0 /100 | #221 | Tragic 21.8% |
| Immigrants | Eritrea | 7.9 /100 | #222 | Tragic 21.8% |
| Scottish | 7.3 /100 | #223 | Tragic 21.8% |
| Barbadians | 7.2 /100 | #224 | Tragic 21.8% |
| English | 6.4 /100 | #225 | Tragic 21.9% |
| Immigrants | Portugal | 5.8 /100 | #226 | Tragic 21.9% |
| Immigrants | Ghana | 5.8 /100 | #227 | Tragic 21.9% |
| Salvadorans | 5.5 /100 | #228 | Tragic 21.9% |
| Tlingit-Haida | 5.4 /100 | #229 | Tragic 21.9% |
| Immigrants | Western Africa | 5.3 /100 | #230 | Tragic 22.0% |
| Welsh | 5.0 /100 | #231 | Tragic 22.0% |
| Immigrants | Thailand | 5.0 /100 | #232 | Tragic 22.0% |
| Spaniards | 4.7 /100 | #233 | Tragic 22.0% |
| Spanish | 4.7 /100 | #234 | Tragic 22.0% |
| Dutch | 4.6 /100 | #235 | Tragic 22.0% |
Demographics Similar to Immigrants from Chile by Single Female Poverty
In terms of single female poverty, the demographic groups most similar to Immigrants from Chile are Brazilian (20.1%, a difference of 0.030%), Immigrants from South Africa (20.1%, a difference of 0.12%), Immigrants from South America (20.0%, a difference of 0.20%), Immigrants from Switzerland (20.0%, a difference of 0.24%), and South American (20.0%, a difference of 0.27%).
| Demographics | Rating | Rank | Single Female Poverty |
| Poles | 95.6 /100 | #117 | Exceptional 20.0% |
| Immigrants | Afghanistan | 95.4 /100 | #118 | Exceptional 20.0% |
| Immigrants | Ethiopia | 95.4 /100 | #119 | Exceptional 20.0% |
| South Americans | 95.1 /100 | #120 | Exceptional 20.0% |
| Immigrants | Switzerland | 95.1 /100 | #121 | Exceptional 20.0% |
| Immigrants | South America | 95.0 /100 | #122 | Exceptional 20.0% |
| Brazilians | 94.4 /100 | #123 | Exceptional 20.1% |
| Immigrants | Chile | 94.3 /100 | #124 | Exceptional 20.1% |
| Immigrants | South Africa | 93.9 /100 | #125 | Exceptional 20.1% |
| Serbians | 93.3 /100 | #126 | Exceptional 20.1% |
| Mongolians | 93.2 /100 | #127 | Exceptional 20.2% |
| Immigrants | Spain | 92.7 /100 | #128 | Exceptional 20.2% |
| Immigrants | Morocco | 92.4 /100 | #129 | Exceptional 20.2% |
| Immigrants | Hungary | 92.3 /100 | #130 | Exceptional 20.2% |
| Pakistanis | 92.1 /100 | #131 | Exceptional 20.2% |