Salvadoran vs Immigrants from Japan Single Female Poverty
COMPARE
Salvadoran
Immigrants from Japan
Single Female Poverty
Single Female Poverty Comparison
Salvadorans
Immigrants from Japan
21.9%
SINGLE FEMALE POVERTY
5.5/ 100
METRIC RATING
228th/ 347
METRIC RANK
18.6%
SINGLE FEMALE POVERTY
99.9/ 100
METRIC RATING
35th/ 347
METRIC RANK
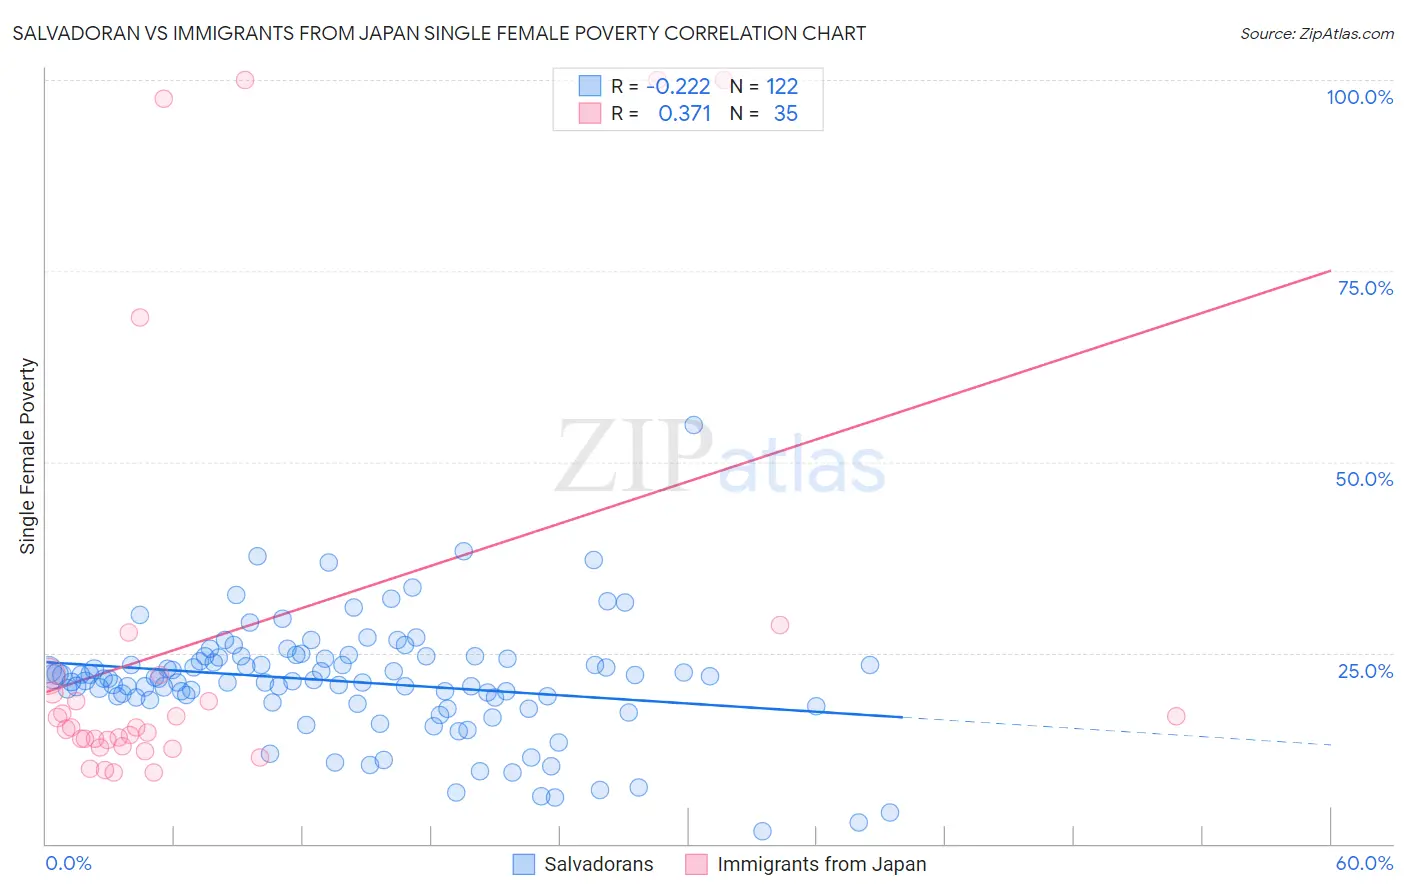
Salvadoran vs Immigrants from Japan Single Female Poverty Correlation Chart
The statistical analysis conducted on geographies consisting of 394,529,574 people shows a weak negative correlation between the proportion of Salvadorans and poverty level among single females in the United States with a correlation coefficient (R) of -0.222 and weighted average of 21.9%. Similarly, the statistical analysis conducted on geographies consisting of 335,522,478 people shows a mild positive correlation between the proportion of Immigrants from Japan and poverty level among single females in the United States with a correlation coefficient (R) of 0.371 and weighted average of 18.6%, a difference of 17.8%.
Single Female Poverty Correlation Summary
| Measurement | Salvadoran | Immigrants from Japan |
| Minimum | 1.6% | 9.4% |
| Maximum | 54.8% | 100.0% |
| Range | 53.2% | 90.6% |
| Mean | 21.2% | 26.7% |
| Median | 21.5% | 15.1% |
| Interquartile 25% (IQ1) | 18.8% | 12.8% |
| Interquartile 75% (IQ3) | 24.3% | 21.9% |
| Interquartile Range (IQR) | 5.5% | 9.2% |
| Standard Deviation (Sample) | 7.6% | 28.3% |
| Standard Deviation (Population) | 7.5% | 27.9% |
Similar Demographics by Single Female Poverty
Demographics Similar to Salvadorans by Single Female Poverty
In terms of single female poverty, the demographic groups most similar to Salvadorans are Tlingit-Haida (21.9%, a difference of 0.030%), Immigrants from Western Africa (22.0%, a difference of 0.050%), Immigrants from Portugal (21.9%, a difference of 0.10%), Immigrants from Ghana (21.9%, a difference of 0.10%), and Welsh (22.0%, a difference of 0.14%).
| Demographics | Rating | Rank | Single Female Poverty |
| Immigrants | Grenada | 8.0 /100 | #221 | Tragic 21.8% |
| Immigrants | Eritrea | 7.9 /100 | #222 | Tragic 21.8% |
| Scottish | 7.3 /100 | #223 | Tragic 21.8% |
| Barbadians | 7.2 /100 | #224 | Tragic 21.8% |
| English | 6.4 /100 | #225 | Tragic 21.9% |
| Immigrants | Portugal | 5.8 /100 | #226 | Tragic 21.9% |
| Immigrants | Ghana | 5.8 /100 | #227 | Tragic 21.9% |
| Salvadorans | 5.5 /100 | #228 | Tragic 21.9% |
| Tlingit-Haida | 5.4 /100 | #229 | Tragic 21.9% |
| Immigrants | Western Africa | 5.3 /100 | #230 | Tragic 22.0% |
| Welsh | 5.0 /100 | #231 | Tragic 22.0% |
| Immigrants | Thailand | 5.0 /100 | #232 | Tragic 22.0% |
| Spaniards | 4.7 /100 | #233 | Tragic 22.0% |
| Spanish | 4.7 /100 | #234 | Tragic 22.0% |
| Dutch | 4.6 /100 | #235 | Tragic 22.0% |
Demographics Similar to Immigrants from Japan by Single Female Poverty
In terms of single female poverty, the demographic groups most similar to Immigrants from Japan are Korean (18.6%, a difference of 0.060%), Turkish (18.7%, a difference of 0.18%), Immigrants from Armenia (18.7%, a difference of 0.20%), Immigrants from Philippines (18.6%, a difference of 0.24%), and Immigrants from Sri Lanka (18.6%, a difference of 0.30%).
| Demographics | Rating | Rank | Single Female Poverty |
| Immigrants | Moldova | 100.0 /100 | #28 | Exceptional 18.5% |
| Immigrants | Poland | 100.0 /100 | #29 | Exceptional 18.5% |
| Immigrants | North Macedonia | 99.9 /100 | #30 | Exceptional 18.5% |
| Immigrants | Asia | 99.9 /100 | #31 | Exceptional 18.6% |
| Immigrants | Sri Lanka | 99.9 /100 | #32 | Exceptional 18.6% |
| Immigrants | Philippines | 99.9 /100 | #33 | Exceptional 18.6% |
| Koreans | 99.9 /100 | #34 | Exceptional 18.6% |
| Immigrants | Japan | 99.9 /100 | #35 | Exceptional 18.6% |
| Turks | 99.9 /100 | #36 | Exceptional 18.7% |
| Immigrants | Armenia | 99.9 /100 | #37 | Exceptional 18.7% |
| Tongans | 99.9 /100 | #38 | Exceptional 18.8% |
| Bulgarians | 99.9 /100 | #39 | Exceptional 18.8% |
| Okinawans | 99.9 /100 | #40 | Exceptional 18.8% |
| Immigrants | Serbia | 99.9 /100 | #41 | Exceptional 18.8% |
| Jordanians | 99.9 /100 | #42 | Exceptional 18.8% |