Salvadoran vs Ghanaian Single Female Poverty

COMPARE

Salvadoran
Race
Ancestry
AfghanAfricanAlaska NativeAlaskan AthabascanAlbanianAleutAlsatianAmericanApacheArabArapahoArgentineanArmenianAssyrian/Chaldean/SyriacAustralianAustrianBahamianBangladeshiBarbadianBasqueBelgianBelizeanBermudanBhutaneseBlackfeetBolivianBrazilianBritishBritish West IndianBulgarianBurmeseCajunCambodianCanadianCape VerdeanCarpatho RusynCelticCentral AmericanCentral American IndianCherokeeCheyenneChickasawChileanChineseChippewaChoctawColombianColvilleComancheCosta RicanCreeCreekCroatianCrowCubanCypriotCzechCzechoslovakianDanishDelawareDominicanDutchDutch West IndianEastern EuropeanEcuadorianEgyptianEnglishEstonianEthiopianEuropeanFijianFilipinoFinnishFrenchFrench American IndianFrench CanadianGermanGerman RussianGreekGuamanian/ChamorroGuatemalanGuyaneseHaitianHmongHonduranHopiHoumaHungarianIcelanderIndian (Asian)IndonesianInupiatIranianIraqiIrishIroquoisIsraeliItalianJamaicanJapaneseJordanianKenyanKiowaKoreanLaotianLatvianLebaneseLiberianLithuanianLumbeeLuxembourgerMacedonianMalaysianMalteseMarshalleseMenomineeMexicanMexican American IndianMongolianMoroccanNative HawaiianNavajoNepaleseNew ZealanderNicaraguanNigerianNorthern EuropeanNorwegianOkinawanOsageOttawaPaiutePakistaniPalestinianPanamanianParaguayanPennsylvania GermanPeruvianPimaPolishPortuguesePotawatomiPuebloPuerto RicanPuget Sound SalishRomanianRussianSalvadoranSamoanScandinavianScotch-IrishScottishSeminoleSenegaleseSerbianShoshoneSierra LeoneanSiouxSlavicSlovakSloveneSomaliSouth AfricanSouth AmericanSouth American IndianSoviet UnionSpaniardSpanishSpanish AmericanSpanish American IndianSri LankanSubsaharan AfricanSudaneseSwedishSwissSyrianTaiwaneseThaiTlingit-HaidaTohono O'OdhamTonganTrinidadian and TobagonianTsimshianTurkishU.S. Virgin IslanderUgandanUkrainianUruguayanUteVenezuelanVietnameseWelshWest IndianYakamaYaquiYugoslavianYumanYup'ikZimbabwean
Immigration
NonimmigrantsImmigrantsAfghanistanAfricaAlbaniaArgentinaArmeniaAsiaAustraliaAustriaBahamasBangladeshBarbadosBelarusBelgiumBelizeBoliviaBosnia and HerzegovinaBrazilBulgariaBurma/MyanmarCabo VerdeCambodiaCameroonCanadaCaribbeanCentral AmericaChileChinaColombiaCongoCosta RicaCroatiaCubaCzechoslovakiaDenmarkDominicaDominican RepublicEastern AfricaEastern AsiaEastern EuropeEcuadorEgyptEl SalvadorEnglandEritreaEthiopiaEuropeFijiFranceGermanyGhanaGreeceGrenadaGuatemalaGuyanaHaitiHondurasHong KongHungaryIndiaIndonesiaIranIraqIrelandIsraelItalyJamaicaJapanJordanKazakhstanKenyaKoreaKuwaitLaosLatin AmericaLatviaLebanonLiberiaLithuaniaMalaysiaMexicoMicronesiaMiddle AfricaMoldovaMoroccoNepalNetherlandsNicaraguaNigeriaNorth AmericaNorth MacedoniaNorthern AfricaNorthern EuropeNorwayOceaniaPakistanPanamaPeruPhilippinesPolandPortugalRomaniaRussiaSaudi ArabiaScotlandSenegalSerbiaSierra LeoneSingaporeSomaliaSouth AfricaSouth AmericaSouth Central AsiaSouth Eastern AsiaSouthern EuropeSpainSri LankaSt. Vincent and the GrenadinesSudanSwedenSwitzerlandSyriaTaiwanThailandTrinidad and TobagoTurkeyUgandaUkraineUruguayUzbekistanVenezuelaVietnamWest IndiesWestern AfricaWestern AsiaWestern EuropeYemenZaireZimbabweAzores
Ghanaian
Race
Ancestry
AfghanAfricanAlaska NativeAlaskan AthabascanAlbanianAleutAlsatianAmericanApacheArabArapahoArgentineanArmenianAssyrian/Chaldean/SyriacAustralianAustrianBahamianBangladeshiBarbadianBasqueBelgianBelizeanBermudanBhutaneseBlackfeetBolivianBrazilianBritishBritish West IndianBulgarianBurmeseCajunCambodianCanadianCape VerdeanCarpatho RusynCelticCentral AmericanCentral American IndianCherokeeCheyenneChickasawChileanChineseChippewaChoctawColombianColvilleComancheCosta RicanCreeCreekCroatianCrowCubanCypriotCzechCzechoslovakianDanishDelawareDominicanDutchDutch West IndianEastern EuropeanEcuadorianEgyptianEnglishEstonianEthiopianEuropeanFijianFilipinoFinnishFrenchFrench American IndianFrench CanadianGermanGerman RussianGhanaianGreekGuamanian/ChamorroGuatemalanGuyaneseHaitianHmongHonduranHopiHoumaHungarianIcelanderIndian (Asian)IndonesianInupiatIranianIraqiIrishIroquoisIsraeliItalianJamaicanJapaneseJordanianKenyanKiowaKoreanLaotianLatvianLebaneseLiberianLithuanianLumbeeLuxembourgerMacedonianMalaysianMalteseMarshalleseMenomineeMexicanMexican American IndianMongolianMoroccanNative HawaiianNavajoNepaleseNew ZealanderNicaraguanNigerianNorthern EuropeanNorwegianOkinawanOsageOttawaPaiutePakistaniPalestinianPanamanianParaguayanPennsylvania GermanPeruvianPimaPolishPortuguesePotawatomiPuebloPuerto RicanPuget Sound SalishRomanianRussianSamoanScandinavianScotch-IrishScottishSeminoleSenegaleseSerbianShoshoneSierra LeoneanSiouxSlavicSlovakSloveneSomaliSouth AfricanSouth AmericanSouth American IndianSoviet UnionSpaniardSpanishSpanish AmericanSpanish American IndianSri LankanSubsaharan AfricanSudaneseSwedishSwissSyrianTaiwaneseThaiTlingit-HaidaTohono O'OdhamTonganTrinidadian and TobagonianTsimshianTurkishU.S. Virgin IslanderUgandanUkrainianUruguayanUteVenezuelanVietnameseWelshWest IndianYakamaYaquiYugoslavianYumanYup'ikZimbabwean
Immigration
NonimmigrantsImmigrantsAfghanistanAfricaAlbaniaArgentinaArmeniaAsiaAustraliaAustriaBahamasBangladeshBarbadosBelarusBelgiumBelizeBoliviaBosnia and HerzegovinaBrazilBulgariaBurma/MyanmarCabo VerdeCambodiaCameroonCanadaCaribbeanCentral AmericaChileChinaColombiaCongoCosta RicaCroatiaCubaCzechoslovakiaDenmarkDominicaDominican RepublicEastern AfricaEastern AsiaEastern EuropeEcuadorEgyptEl SalvadorEnglandEritreaEthiopiaEuropeFijiFranceGermanyGhanaGreeceGrenadaGuatemalaGuyanaHaitiHondurasHong KongHungaryIndiaIndonesiaIranIraqIrelandIsraelItalyJamaicaJapanJordanKazakhstanKenyaKoreaKuwaitLaosLatin AmericaLatviaLebanonLiberiaLithuaniaMalaysiaMexicoMicronesiaMiddle AfricaMoldovaMoroccoNepalNetherlandsNicaraguaNigeriaNorth AmericaNorth MacedoniaNorthern AfricaNorthern EuropeNorwayOceaniaPakistanPanamaPeruPhilippinesPolandPortugalRomaniaRussiaSaudi ArabiaScotlandSenegalSerbiaSierra LeoneSingaporeSomaliaSouth AfricaSouth AmericaSouth Central AsiaSouth Eastern AsiaSouthern EuropeSpainSri LankaSt. Vincent and the GrenadinesSudanSwedenSwitzerlandSyriaTaiwanThailandTrinidad and TobagoTurkeyUgandaUkraineUruguayUzbekistanVenezuelaVietnamWest IndiesWestern AfricaWestern AsiaWestern EuropeYemenZaireZimbabweAzores
Single Female Poverty
Income
Poverty
Unemployment
Labor Participation
Family Structure
Vehicle Availability
Education Level
Disability

Single Female Poverty Comparison

Salvadorans

Ghanaians

Tragic
Poor
21.9%
SINGLE FEMALE POVERTY
5.5/ 100
METRIC RATING
228th/ 347
METRIC RANK
21.6%
SINGLE FEMALE POVERTY
15.7/ 100
METRIC RATING
207th/ 347
METRIC RANK

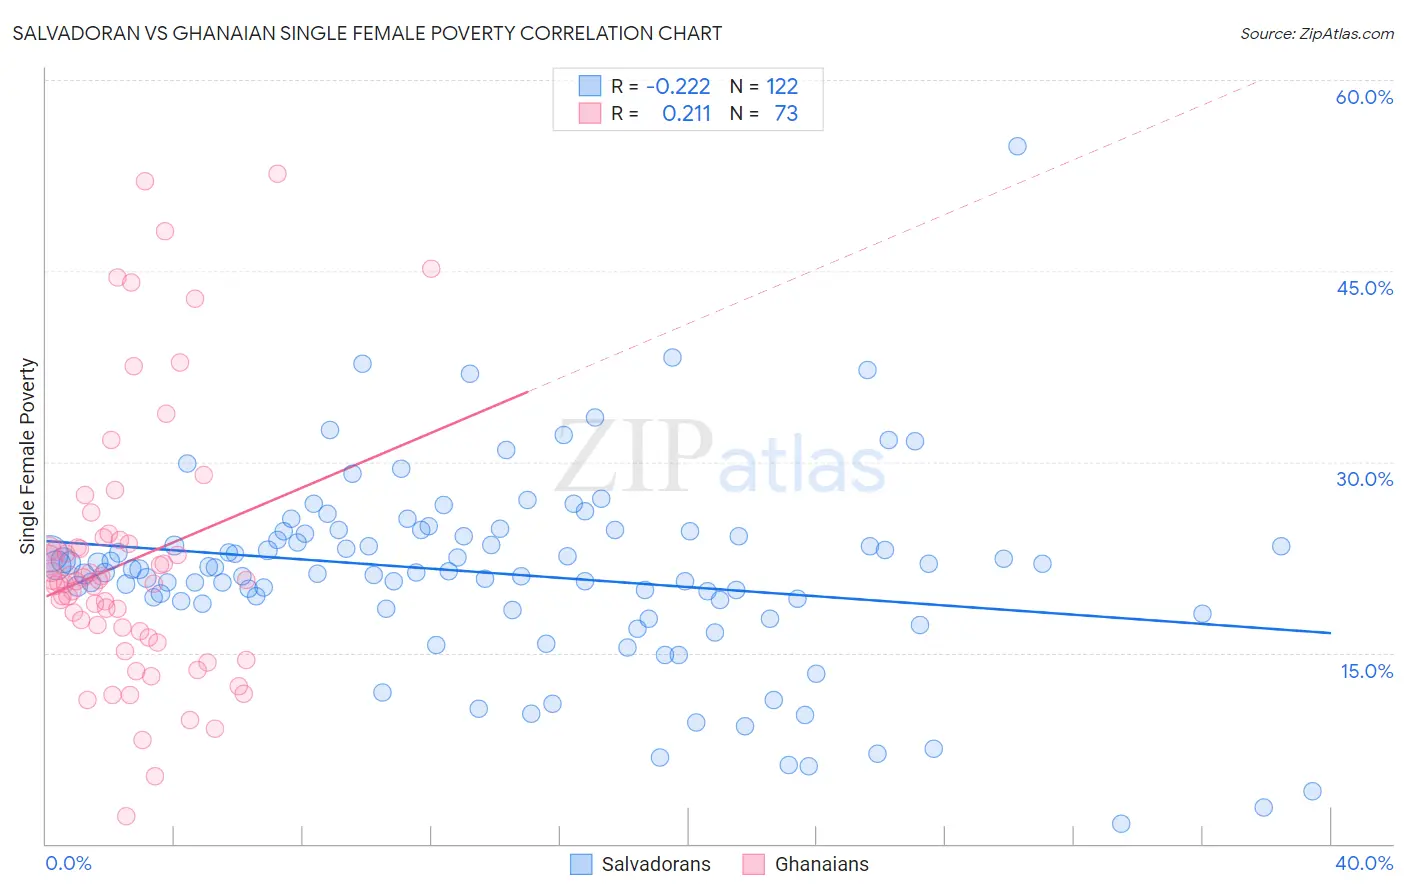
Salvadoran vs Ghanaian Single Female Poverty Correlation Chart

The statistical analysis conducted on geographies consisting of 394,529,574 people shows a weak negative correlation between the proportion of Salvadorans and poverty level among single females in the United States with a correlation coefficient (R) of -0.222 and weighted average of 21.9%. Similarly, the statistical analysis conducted on geographies consisting of 189,278,551 people shows a weak positive correlation between the proportion of Ghanaians and poverty level among single females in the United States with a correlation coefficient (R) of 0.211 and weighted average of 21.6%, a difference of 1.8%.
Salvadoran vs Ghanaian Single Female Poverty

Single Female Poverty Correlation Summary

MeasurementSalvadoranGhanaian
Minimum1.6%2.1%
Maximum54.8%52.6%
Range53.2%50.5%
Mean21.2%22.2%
Median21.5%20.7%
Interquartile 25% (IQ1)18.8%16.5%
Interquartile 75% (IQ3)24.3%23.7%
Interquartile Range (IQR)5.5%7.2%
Standard Deviation (Sample)7.6%10.4%
Standard Deviation (Population)7.5%10.3%

Similar Demographics by Single Female Poverty

Demographics Similar to Salvadorans by Single Female Poverty

In terms of single female poverty, the demographic groups most similar to Salvadorans are Tlingit-Haida (21.9%, a difference of 0.030%), Immigrants from Western Africa (22.0%, a difference of 0.050%), Immigrants from Portugal (21.9%, a difference of 0.10%), Immigrants from Ghana (21.9%, a difference of 0.10%), and Welsh (22.0%, a difference of 0.14%).
DemographicsRating | RankSingle Female Poverty
Immigrants | Grenada
8.0
/100
|
#221
Tragic
21.8%
Immigrants | Eritrea
7.9
/100
|
#222
Tragic
21.8%
Scottish
7.3
/100
|
#223
Tragic
21.8%
Barbadians
7.2
/100
|
#224
Tragic
21.8%
English
6.4
/100
|
#225
Tragic
21.9%
Immigrants | Portugal
5.8
/100
|
#226
Tragic
21.9%
Immigrants | Ghana
5.8
/100
|
#227
Tragic
21.9%
Salvadorans
5.5
/100
|
#228
Tragic
21.9%
Tlingit-Haida
5.4
/100
|
#229
Tragic
21.9%
Immigrants | Western Africa
5.3
/100
|
#230
Tragic
22.0%
Welsh
5.0
/100
|
#231
Tragic
22.0%
Immigrants | Thailand
5.0
/100
|
#232
Tragic
22.0%
Spaniards
4.7
/100
|
#233
Tragic
22.0%
Spanish
4.7
/100
|
#234
Tragic
22.0%
Dutch
4.6
/100
|
#235
Tragic
22.0%

Demographics Similar to Ghanaians by Single Female Poverty

In terms of single female poverty, the demographic groups most similar to Ghanaians are Belgian (21.5%, a difference of 0.040%), Haitian (21.6%, a difference of 0.040%), Finnish (21.5%, a difference of 0.050%), Immigrants from Eastern Africa (21.6%, a difference of 0.070%), and Immigrants from Africa (21.5%, a difference of 0.11%).
DemographicsRating | RankSingle Female Poverty
Irish
21.4
/100
|
#200
Fair
21.4%
Nigerians
20.9
/100
|
#201
Fair
21.4%
Immigrants | Kenya
20.7
/100
|
#202
Fair
21.4%
Immigrants | Haiti
18.8
/100
|
#203
Poor
21.5%
Immigrants | Africa
16.7
/100
|
#204
Poor
21.5%
Finns
16.2
/100
|
#205
Poor
21.5%
Belgians
16.1
/100
|
#206
Poor
21.5%
Ghanaians
15.7
/100
|
#207
Poor
21.6%
Haitians
15.4
/100
|
#208
Poor
21.6%
Immigrants | Eastern Africa
15.1
/100
|
#209
Poor
21.6%
Immigrants | Panama
14.4
/100
|
#210
Poor
21.6%
Icelanders
14.0
/100
|
#211
Poor
21.6%
Jamaicans
14.0
/100
|
#212
Poor
21.6%
Guamanians/Chamorros
13.7
/100
|
#213
Poor
21.6%
Immigrants | Nicaragua
13.3
/100
|
#214
Poor
21.6%