Salvadoran vs American Single Male Poverty
COMPARE
Salvadoran
American
Single Male Poverty
Single Male Poverty Comparison
Salvadorans
Americans
12.5%
SINGLE MALE POVERTY
83.7/ 100
METRIC RATING
132nd/ 347
METRIC RANK
15.8%
SINGLE MALE POVERTY
0.0/ 100
METRIC RATING
309th/ 347
METRIC RANK
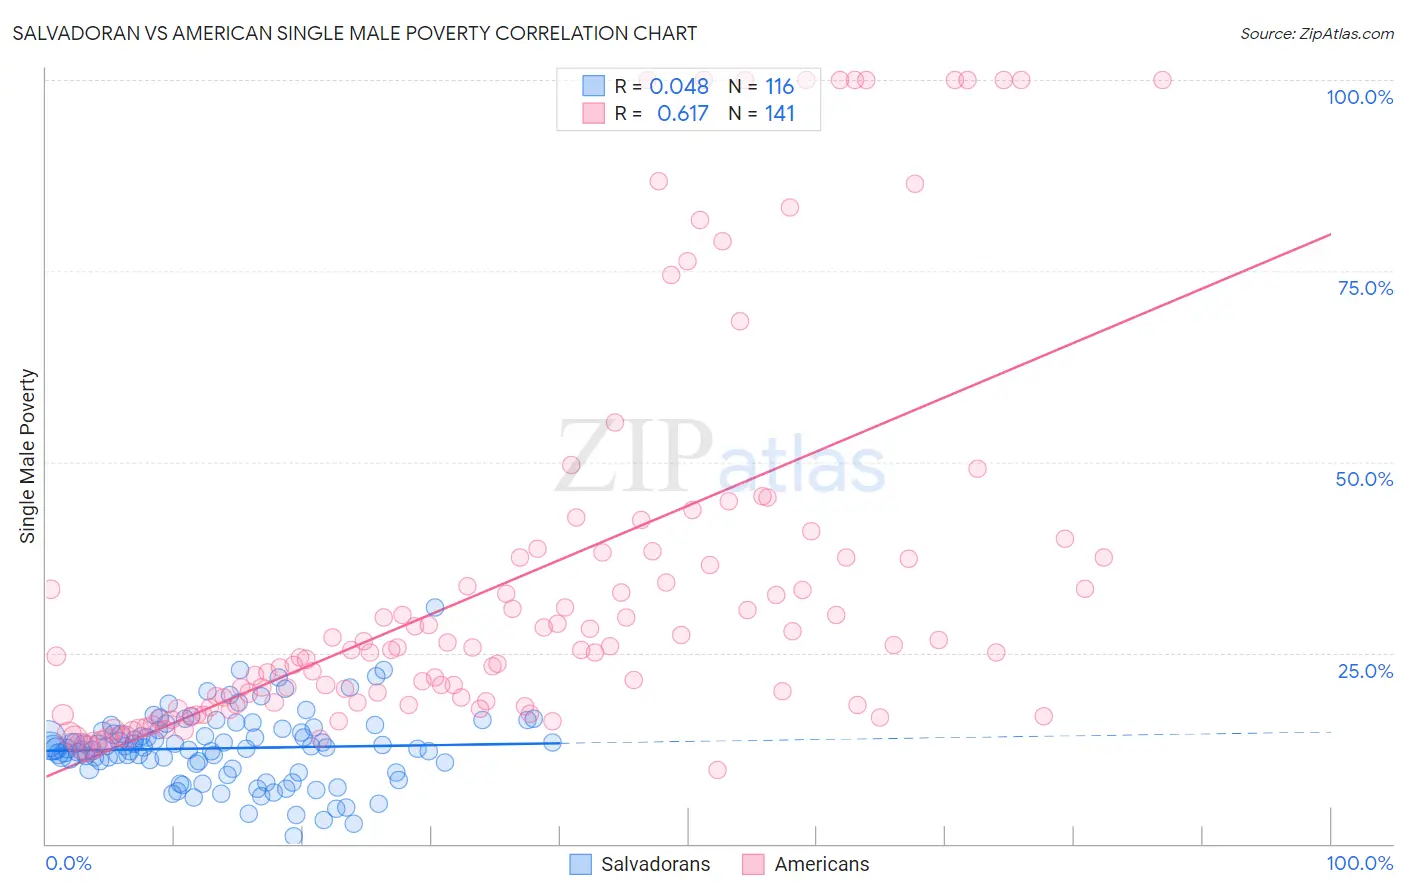
Salvadoran vs American Single Male Poverty Correlation Chart
The statistical analysis conducted on geographies consisting of 358,837,331 people shows no correlation between the proportion of Salvadorans and poverty level among single males in the United States with a correlation coefficient (R) of 0.048 and weighted average of 12.5%. Similarly, the statistical analysis conducted on geographies consisting of 478,139,646 people shows a significant positive correlation between the proportion of Americans and poverty level among single males in the United States with a correlation coefficient (R) of 0.617 and weighted average of 15.8%, a difference of 26.1%.
Single Male Poverty Correlation Summary
| Measurement | Salvadoran | American |
| Minimum | 1.0% | 9.7% |
| Maximum | 30.9% | 100.0% |
| Range | 29.9% | 90.3% |
| Mean | 12.5% | 34.5% |
| Median | 12.6% | 25.4% |
| Interquartile 25% (IQ1) | 10.2% | 18.2% |
| Interquartile 75% (IQ3) | 14.9% | 37.5% |
| Interquartile Range (IQR) | 4.7% | 19.3% |
| Standard Deviation (Sample) | 4.7% | 25.3% |
| Standard Deviation (Population) | 4.6% | 25.2% |
Similar Demographics by Single Male Poverty
Demographics Similar to Salvadorans by Single Male Poverty
In terms of single male poverty, the demographic groups most similar to Salvadorans are Immigrants from Northern Europe (12.5%, a difference of 0.0%), Immigrants from Western Asia (12.5%, a difference of 0.030%), Immigrants from Nicaragua (12.5%, a difference of 0.12%), Immigrants from Ecuador (12.5%, a difference of 0.15%), and Immigrants from Costa Rica (12.5%, a difference of 0.17%).
| Demographics | Rating | Rank | Single Male Poverty |
| Immigrants | Jordan | 87.1 /100 | #125 | Excellent 12.5% |
| Romanians | 86.4 /100 | #126 | Excellent 12.5% |
| Immigrants | Netherlands | 86.2 /100 | #127 | Excellent 12.5% |
| Ecuadorians | 85.9 /100 | #128 | Excellent 12.5% |
| Immigrants | Sierra Leone | 85.5 /100 | #129 | Excellent 12.5% |
| Immigrants | Nicaragua | 84.8 /100 | #130 | Excellent 12.5% |
| Immigrants | Northern Europe | 83.7 /100 | #131 | Excellent 12.5% |
| Salvadorans | 83.7 /100 | #132 | Excellent 12.5% |
| Immigrants | Western Asia | 83.4 /100 | #133 | Excellent 12.5% |
| Immigrants | Ecuador | 82.1 /100 | #134 | Excellent 12.5% |
| Immigrants | Costa Rica | 81.9 /100 | #135 | Excellent 12.5% |
| Immigrants | Austria | 81.9 /100 | #136 | Excellent 12.5% |
| Ukrainians | 80.7 /100 | #137 | Excellent 12.6% |
| Immigrants | El Salvador | 80.0 /100 | #138 | Excellent 12.6% |
| Cubans | 79.9 /100 | #139 | Good 12.6% |
Demographics Similar to Americans by Single Male Poverty
In terms of single male poverty, the demographic groups most similar to Americans are Potawatomi (15.8%, a difference of 0.17%), Ute (15.7%, a difference of 0.73%), Yakama (15.9%, a difference of 0.87%), Seminole (16.0%, a difference of 1.4%), and Comanche (16.0%, a difference of 1.4%).
| Demographics | Rating | Rank | Single Male Poverty |
| Alsatians | 0.0 /100 | #302 | Tragic 15.2% |
| Aleuts | 0.0 /100 | #303 | Tragic 15.4% |
| Alaska Natives | 0.0 /100 | #304 | Tragic 15.4% |
| Blackfeet | 0.0 /100 | #305 | Tragic 15.5% |
| Pennsylvania Germans | 0.0 /100 | #306 | Tragic 15.6% |
| Ute | 0.0 /100 | #307 | Tragic 15.7% |
| Potawatomi | 0.0 /100 | #308 | Tragic 15.8% |
| Americans | 0.0 /100 | #309 | Tragic 15.8% |
| Yakama | 0.0 /100 | #310 | Tragic 15.9% |
| Seminole | 0.0 /100 | #311 | Tragic 16.0% |
| Comanche | 0.0 /100 | #312 | Tragic 16.0% |
| Cherokee | 0.0 /100 | #313 | Tragic 16.1% |
| Alaskan Athabascans | 0.0 /100 | #314 | Tragic 16.1% |
| Cheyenne | 0.0 /100 | #315 | Tragic 16.1% |
| Dutch West Indians | 0.0 /100 | #316 | Tragic 16.1% |