Salvadoran vs American Per Capita Income
COMPARE
Salvadoran
American
Per Capita Income
Per Capita Income Comparison
Salvadorans
Americans
$38,858
PER CAPITA INCOME
0.5/ 100
METRIC RATING
266th/ 347
METRIC RANK
$39,039
PER CAPITA INCOME
0.6/ 100
METRIC RATING
264th/ 347
METRIC RANK
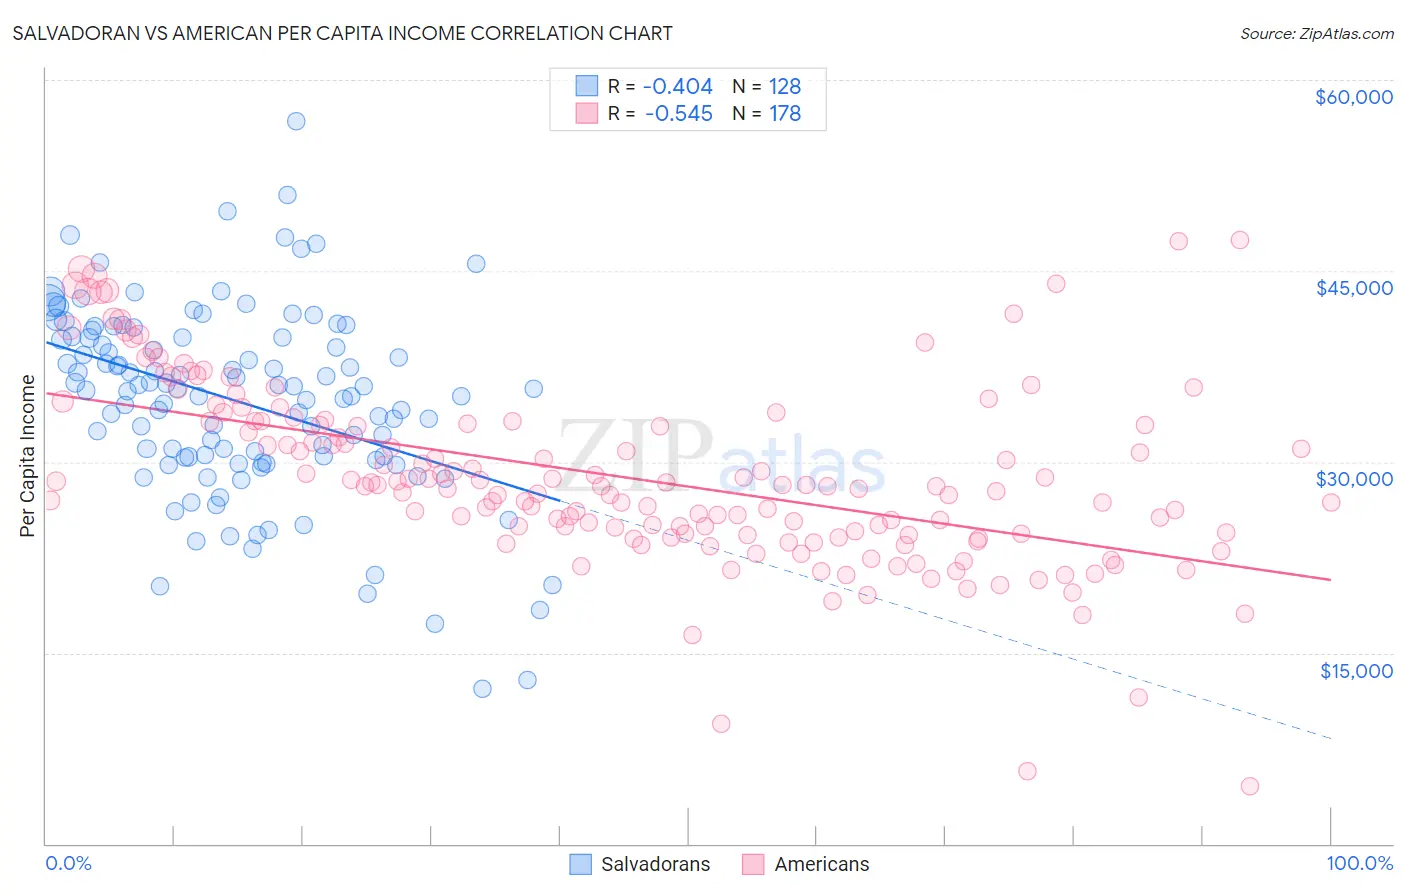
Salvadoran vs American Per Capita Income Correlation Chart
The statistical analysis conducted on geographies consisting of 399,090,197 people shows a moderate negative correlation between the proportion of Salvadorans and per capita income in the United States with a correlation coefficient (R) of -0.404 and weighted average of $38,858. Similarly, the statistical analysis conducted on geographies consisting of 582,039,940 people shows a substantial negative correlation between the proportion of Americans and per capita income in the United States with a correlation coefficient (R) of -0.545 and weighted average of $39,039, a difference of 0.47%.
Per Capita Income Correlation Summary
| Measurement | Salvadoran | American |
| Minimum | $12,183 | $4,486 |
| Maximum | $56,804 | $47,414 |
| Range | $44,621 | $42,928 |
| Mean | $34,754 | $28,778 |
| Median | $35,664 | $28,107 |
| Interquartile 25% (IQ1) | $30,375 | $24,336 |
| Interquartile 75% (IQ3) | $39,784 | $33,158 |
| Interquartile Range (IQR) | $9,409 | $8,822 |
| Standard Deviation (Sample) | $7,521 | $7,186 |
| Standard Deviation (Population) | $7,492 | $7,166 |
Demographics Similar to Salvadorans and Americans by Per Capita Income
In terms of per capita income, the demographic groups most similar to Salvadorans are Immigrants from Zaire ($38,848, a difference of 0.030%), Liberian ($38,780, a difference of 0.20%), Immigrants from Jamaica ($38,766, a difference of 0.24%), Spanish American ($39,012, a difference of 0.40%), and Belizean ($39,097, a difference of 0.61%). Similarly, the demographic groups most similar to Americans are Spanish American ($39,012, a difference of 0.070%), Belizean ($39,097, a difference of 0.15%), Iroquois ($39,104, a difference of 0.16%), Marshallese ($39,108, a difference of 0.17%), and Alaskan Athabascan ($39,163, a difference of 0.32%).
| Demographics | Rating | Rank | Per Capita Income |
| Immigrants | Middle Africa | 1.0 /100 | #255 | Tragic $39,529 |
| Hawaiians | 0.8 /100 | #256 | Tragic $39,403 |
| Nicaraguans | 0.8 /100 | #257 | Tragic $39,372 |
| Jamaicans | 0.7 /100 | #258 | Tragic $39,231 |
| Malaysians | 0.7 /100 | #259 | Tragic $39,194 |
| Alaskan Athabascans | 0.6 /100 | #260 | Tragic $39,163 |
| Marshallese | 0.6 /100 | #261 | Tragic $39,108 |
| Iroquois | 0.6 /100 | #262 | Tragic $39,104 |
| Belizeans | 0.6 /100 | #263 | Tragic $39,097 |
| Americans | 0.6 /100 | #264 | Tragic $39,039 |
| Spanish Americans | 0.5 /100 | #265 | Tragic $39,012 |
| Salvadorans | 0.5 /100 | #266 | Tragic $38,858 |
| Immigrants | Zaire | 0.4 /100 | #267 | Tragic $38,848 |
| Liberians | 0.4 /100 | #268 | Tragic $38,780 |
| Immigrants | Jamaica | 0.4 /100 | #269 | Tragic $38,766 |
| Immigrants | Belize | 0.3 /100 | #270 | Tragic $38,614 |
| Central Americans | 0.3 /100 | #271 | Tragic $38,560 |
| Immigrants | Cabo Verde | 0.3 /100 | #272 | Tragic $38,540 |
| Nepalese | 0.3 /100 | #273 | Tragic $38,442 |
| Immigrants | El Salvador | 0.3 /100 | #274 | Tragic $38,394 |
| Immigrants | Liberia | 0.2 /100 | #275 | Tragic $38,165 |