Puget Sound Salish vs Uruguayan Married-Couple Family Poverty
COMPARE
Puget Sound Salish
Uruguayan
Married-Couple Family Poverty
Married-Couple Family Poverty Comparison
Puget Sound Salish
Uruguayans
4.9%
MARRIED-COUPLE FAMILY POVERTY
90.4/ 100
METRIC RATING
132nd/ 347
METRIC RANK
5.4%
MARRIED-COUPLE FAMILY POVERTY
25.0/ 100
METRIC RATING
199th/ 347
METRIC RANK
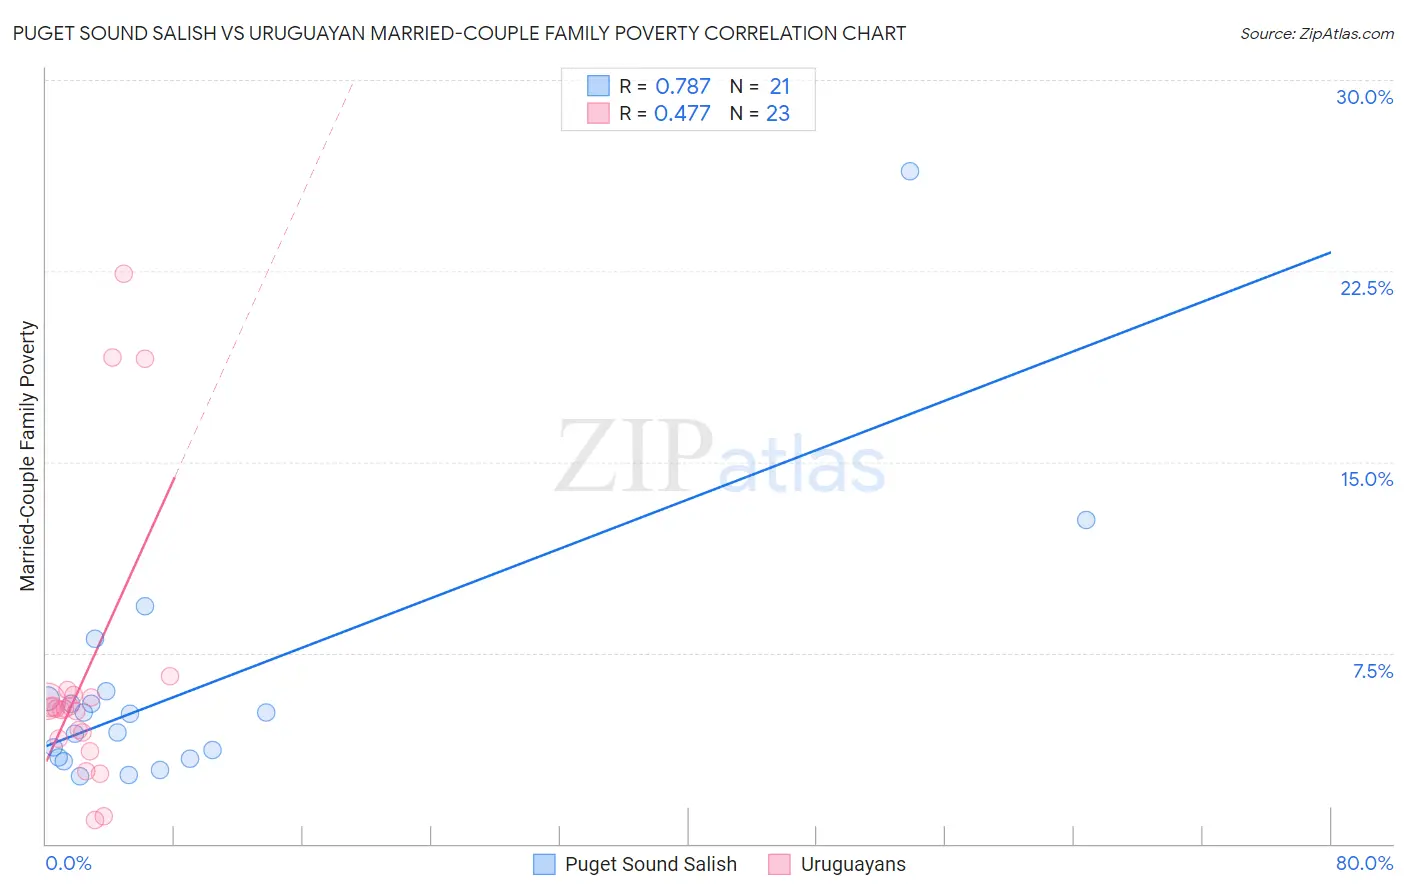
Puget Sound Salish vs Uruguayan Married-Couple Family Poverty Correlation Chart
The statistical analysis conducted on geographies consisting of 46,044,429 people shows a strong positive correlation between the proportion of Puget Sound Salish and poverty level among married-couple families in the United States with a correlation coefficient (R) of 0.787 and weighted average of 4.9%. Similarly, the statistical analysis conducted on geographies consisting of 144,309,932 people shows a moderate positive correlation between the proportion of Uruguayans and poverty level among married-couple families in the United States with a correlation coefficient (R) of 0.477 and weighted average of 5.4%, a difference of 10.4%.
Married-Couple Family Poverty Correlation Summary
| Measurement | Puget Sound Salish | Uruguayan |
| Minimum | 2.7% | 0.92% |
| Maximum | 26.4% | 22.4% |
| Range | 23.8% | 21.5% |
| Mean | 6.1% | 6.6% |
| Median | 5.1% | 5.3% |
| Interquartile 25% (IQ1) | 3.4% | 4.1% |
| Interquartile 75% (IQ3) | 5.8% | 5.8% |
| Interquartile Range (IQR) | 2.5% | 1.7% |
| Standard Deviation (Sample) | 5.2% | 5.6% |
| Standard Deviation (Population) | 5.1% | 5.5% |
Similar Demographics by Married-Couple Family Poverty
Demographics Similar to Puget Sound Salish by Married-Couple Family Poverty
In terms of married-couple family poverty, the demographic groups most similar to Puget Sound Salish are Immigrants from Eastern Europe (4.9%, a difference of 0.010%), Immigrants from Kenya (4.9%, a difference of 0.070%), Soviet Union (4.9%, a difference of 0.080%), Samoan (4.9%, a difference of 0.080%), and Immigrants from Pakistan (4.9%, a difference of 0.090%).
| Demographics | Rating | Rank | Married-Couple Family Poverty |
| Immigrants | Bosnia and Herzegovina | 92.5 /100 | #125 | Exceptional 4.8% |
| Immigrants | Asia | 92.3 /100 | #126 | Exceptional 4.8% |
| Egyptians | 92.0 /100 | #127 | Exceptional 4.8% |
| Palestinians | 91.2 /100 | #128 | Exceptional 4.9% |
| Immigrants | Pakistan | 90.7 /100 | #129 | Exceptional 4.9% |
| Soviet Union | 90.7 /100 | #130 | Exceptional 4.9% |
| Immigrants | Eastern Europe | 90.5 /100 | #131 | Exceptional 4.9% |
| Puget Sound Salish | 90.4 /100 | #132 | Exceptional 4.9% |
| Immigrants | Kenya | 90.2 /100 | #133 | Exceptional 4.9% |
| Samoans | 90.2 /100 | #134 | Exceptional 4.9% |
| Assyrians/Chaldeans/Syriacs | 89.4 /100 | #135 | Excellent 4.9% |
| Immigrants | Hungary | 88.7 /100 | #136 | Excellent 4.9% |
| Guamanians/Chamorros | 86.5 /100 | #137 | Excellent 4.9% |
| Chileans | 86.0 /100 | #138 | Excellent 4.9% |
| German Russians | 85.1 /100 | #139 | Excellent 5.0% |
Demographics Similar to Uruguayans by Married-Couple Family Poverty
In terms of married-couple family poverty, the demographic groups most similar to Uruguayans are Immigrants from Morocco (5.4%, a difference of 0.11%), Lebanese (5.4%, a difference of 0.13%), Immigrants from Belarus (5.4%, a difference of 0.18%), Immigrants from Middle Africa (5.4%, a difference of 0.19%), and Liberian (5.4%, a difference of 0.20%).
| Demographics | Rating | Rank | Married-Couple Family Poverty |
| Cape Verdeans | 30.7 /100 | #192 | Fair 5.3% |
| Malaysians | 29.5 /100 | #193 | Fair 5.4% |
| Immigrants | Israel | 27.8 /100 | #194 | Fair 5.4% |
| Immigrants | Azores | 27.5 /100 | #195 | Fair 5.4% |
| Spaniards | 27.4 /100 | #196 | Fair 5.4% |
| Liberians | 26.3 /100 | #197 | Fair 5.4% |
| Immigrants | Belarus | 26.2 /100 | #198 | Fair 5.4% |
| Uruguayans | 25.0 /100 | #199 | Fair 5.4% |
| Immigrants | Morocco | 24.3 /100 | #200 | Fair 5.4% |
| Lebanese | 24.1 /100 | #201 | Fair 5.4% |
| Immigrants | Middle Africa | 23.8 /100 | #202 | Fair 5.4% |
| Immigrants | Peru | 21.8 /100 | #203 | Fair 5.4% |
| Immigrants | Costa Rica | 19.4 /100 | #204 | Poor 5.4% |
| Chippewa | 18.9 /100 | #205 | Poor 5.4% |
| Osage | 18.4 /100 | #206 | Poor 5.4% |