Puget Sound Salish vs Immigrants from India Married-Couple Family Poverty
COMPARE
Puget Sound Salish
Immigrants from India
Married-Couple Family Poverty
Married-Couple Family Poverty Comparison
Puget Sound Salish
Immigrants from India
4.9%
MARRIED-COUPLE FAMILY POVERTY
90.4/ 100
METRIC RATING
132nd/ 347
METRIC RANK
3.6%
MARRIED-COUPLE FAMILY POVERTY
100.0/ 100
METRIC RATING
1st/ 347
METRIC RANK
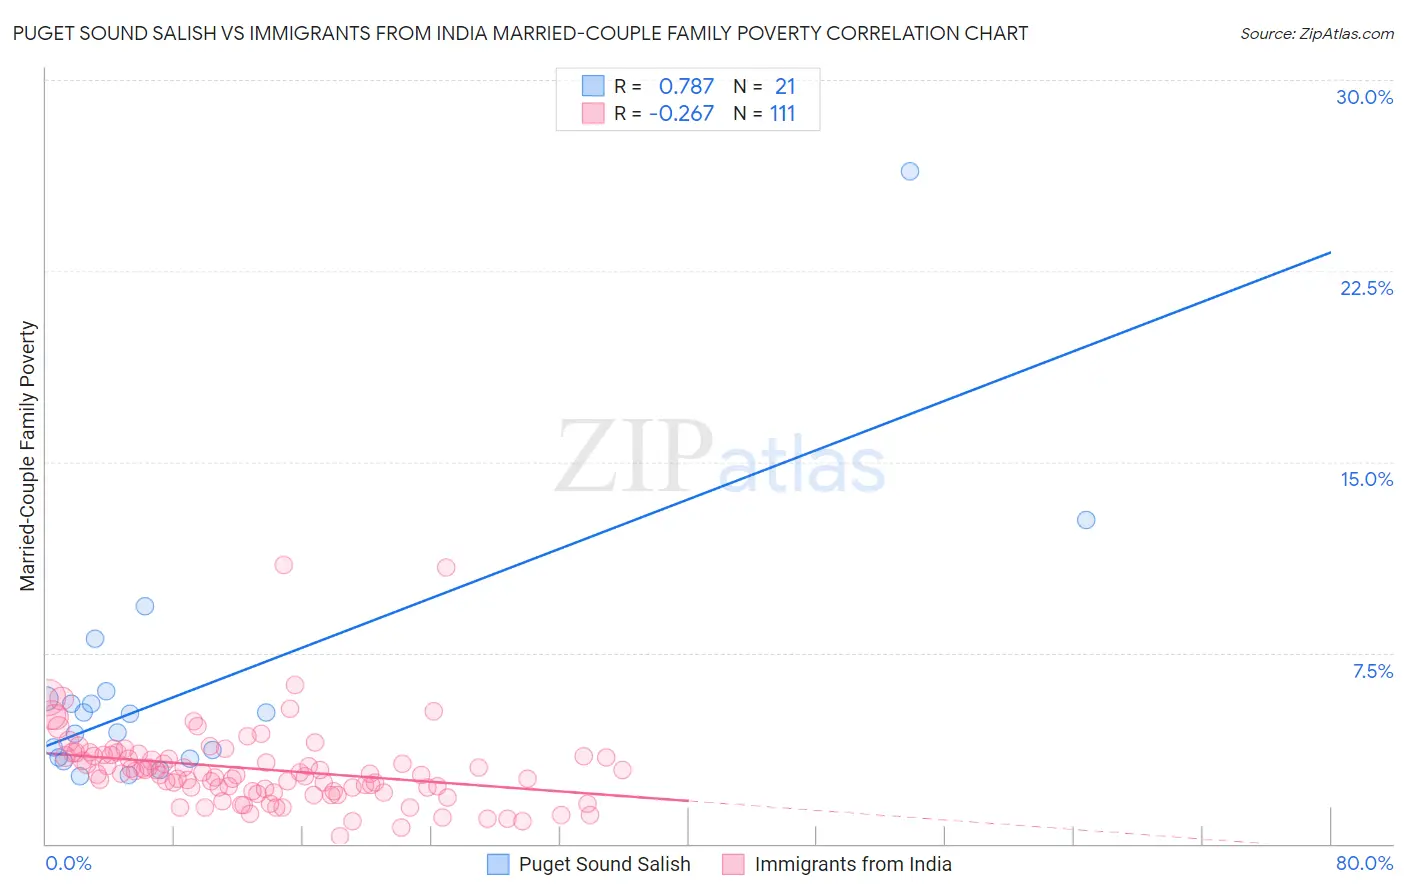
Puget Sound Salish vs Immigrants from India Married-Couple Family Poverty Correlation Chart
The statistical analysis conducted on geographies consisting of 46,044,429 people shows a strong positive correlation between the proportion of Puget Sound Salish and poverty level among married-couple families in the United States with a correlation coefficient (R) of 0.787 and weighted average of 4.9%. Similarly, the statistical analysis conducted on geographies consisting of 429,262,972 people shows a weak negative correlation between the proportion of Immigrants from India and poverty level among married-couple families in the United States with a correlation coefficient (R) of -0.267 and weighted average of 3.6%, a difference of 34.0%.
Married-Couple Family Poverty Correlation Summary
| Measurement | Puget Sound Salish | Immigrants from India |
| Minimum | 2.7% | 0.29% |
| Maximum | 26.4% | 10.9% |
| Range | 23.8% | 10.6% |
| Mean | 6.1% | 2.9% |
| Median | 5.1% | 2.7% |
| Interquartile 25% (IQ1) | 3.4% | 2.1% |
| Interquartile 75% (IQ3) | 5.8% | 3.5% |
| Interquartile Range (IQR) | 2.5% | 1.4% |
| Standard Deviation (Sample) | 5.2% | 1.6% |
| Standard Deviation (Population) | 5.1% | 1.6% |
Similar Demographics by Married-Couple Family Poverty
Demographics Similar to Puget Sound Salish by Married-Couple Family Poverty
In terms of married-couple family poverty, the demographic groups most similar to Puget Sound Salish are Immigrants from Eastern Europe (4.9%, a difference of 0.010%), Immigrants from Kenya (4.9%, a difference of 0.070%), Soviet Union (4.9%, a difference of 0.080%), Samoan (4.9%, a difference of 0.080%), and Immigrants from Pakistan (4.9%, a difference of 0.090%).
| Demographics | Rating | Rank | Married-Couple Family Poverty |
| Immigrants | Bosnia and Herzegovina | 92.5 /100 | #125 | Exceptional 4.8% |
| Immigrants | Asia | 92.3 /100 | #126 | Exceptional 4.8% |
| Egyptians | 92.0 /100 | #127 | Exceptional 4.8% |
| Palestinians | 91.2 /100 | #128 | Exceptional 4.9% |
| Immigrants | Pakistan | 90.7 /100 | #129 | Exceptional 4.9% |
| Soviet Union | 90.7 /100 | #130 | Exceptional 4.9% |
| Immigrants | Eastern Europe | 90.5 /100 | #131 | Exceptional 4.9% |
| Puget Sound Salish | 90.4 /100 | #132 | Exceptional 4.9% |
| Immigrants | Kenya | 90.2 /100 | #133 | Exceptional 4.9% |
| Samoans | 90.2 /100 | #134 | Exceptional 4.9% |
| Assyrians/Chaldeans/Syriacs | 89.4 /100 | #135 | Excellent 4.9% |
| Immigrants | Hungary | 88.7 /100 | #136 | Excellent 4.9% |
| Guamanians/Chamorros | 86.5 /100 | #137 | Excellent 4.9% |
| Chileans | 86.0 /100 | #138 | Excellent 4.9% |
| German Russians | 85.1 /100 | #139 | Excellent 5.0% |
Demographics Similar to Immigrants from India by Married-Couple Family Poverty
In terms of married-couple family poverty, the demographic groups most similar to Immigrants from India are Chinese (3.6%, a difference of 0.18%), Norwegian (3.7%, a difference of 2.1%), Slovene (3.8%, a difference of 5.7%), Swedish (3.9%, a difference of 5.9%), and Luxembourger (3.9%, a difference of 6.6%).
| Demographics | Rating | Rank | Married-Couple Family Poverty |
| Immigrants | India | 100.0 /100 | #1 | Exceptional 3.6% |
| Chinese | 100.0 /100 | #2 | Exceptional 3.6% |
| Norwegians | 100.0 /100 | #3 | Exceptional 3.7% |
| Slovenes | 100.0 /100 | #4 | Exceptional 3.8% |
| Swedes | 100.0 /100 | #5 | Exceptional 3.9% |
| Luxembourgers | 100.0 /100 | #6 | Exceptional 3.9% |
| Latvians | 100.0 /100 | #7 | Exceptional 3.9% |
| Thais | 100.0 /100 | #8 | Exceptional 3.9% |
| Croatians | 100.0 /100 | #9 | Exceptional 3.9% |
| Carpatho Rusyns | 100.0 /100 | #10 | Exceptional 3.9% |
| Lithuanians | 100.0 /100 | #11 | Exceptional 4.0% |
| Bulgarians | 100.0 /100 | #12 | Exceptional 4.0% |
| Czechs | 100.0 /100 | #13 | Exceptional 4.0% |
| Slovaks | 100.0 /100 | #14 | Exceptional 4.0% |
| Poles | 100.0 /100 | #15 | Exceptional 4.0% |