Puget Sound Salish vs Iraqi Married-Couple Family Poverty
COMPARE
Puget Sound Salish
Iraqi
Married-Couple Family Poverty
Married-Couple Family Poverty Comparison
Puget Sound Salish
Iraqis
4.9%
MARRIED-COUPLE FAMILY POVERTY
90.4/ 100
METRIC RATING
132nd/ 347
METRIC RANK
5.9%
MARRIED-COUPLE FAMILY POVERTY
1.4/ 100
METRIC RATING
247th/ 347
METRIC RANK
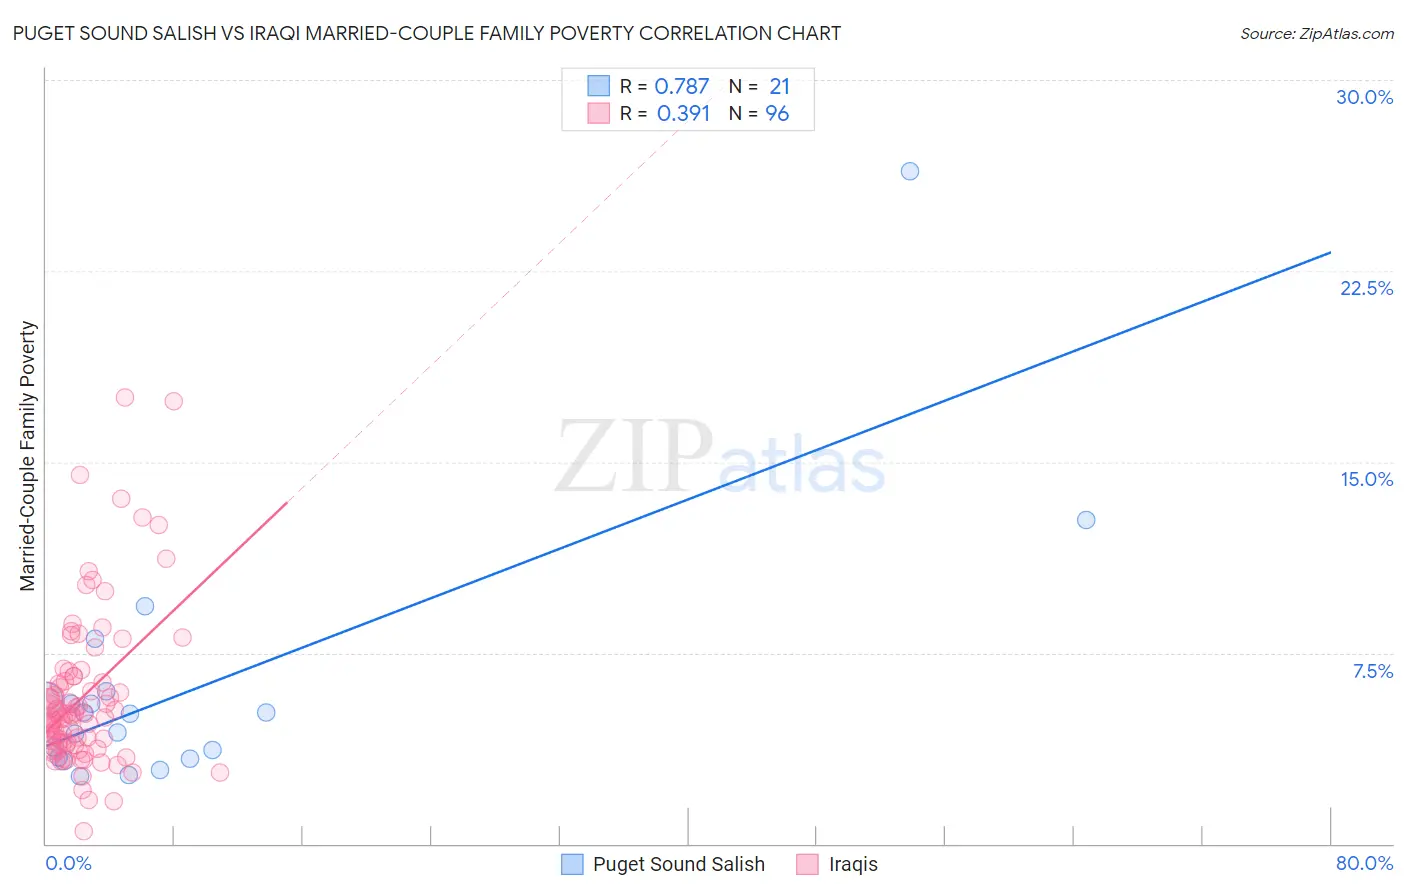
Puget Sound Salish vs Iraqi Married-Couple Family Poverty Correlation Chart
The statistical analysis conducted on geographies consisting of 46,044,429 people shows a strong positive correlation between the proportion of Puget Sound Salish and poverty level among married-couple families in the United States with a correlation coefficient (R) of 0.787 and weighted average of 4.9%. Similarly, the statistical analysis conducted on geographies consisting of 170,086,919 people shows a mild positive correlation between the proportion of Iraqis and poverty level among married-couple families in the United States with a correlation coefficient (R) of 0.391 and weighted average of 5.9%, a difference of 20.2%.
Married-Couple Family Poverty Correlation Summary
| Measurement | Puget Sound Salish | Iraqi |
| Minimum | 2.7% | 0.50% |
| Maximum | 26.4% | 17.6% |
| Range | 23.8% | 17.1% |
| Mean | 6.1% | 5.8% |
| Median | 5.1% | 5.0% |
| Interquartile 25% (IQ1) | 3.4% | 3.9% |
| Interquartile 75% (IQ3) | 5.8% | 6.5% |
| Interquartile Range (IQR) | 2.5% | 2.5% |
| Standard Deviation (Sample) | 5.2% | 3.1% |
| Standard Deviation (Population) | 5.1% | 3.1% |
Similar Demographics by Married-Couple Family Poverty
Demographics Similar to Puget Sound Salish by Married-Couple Family Poverty
In terms of married-couple family poverty, the demographic groups most similar to Puget Sound Salish are Immigrants from Eastern Europe (4.9%, a difference of 0.010%), Immigrants from Kenya (4.9%, a difference of 0.070%), Soviet Union (4.9%, a difference of 0.080%), Samoan (4.9%, a difference of 0.080%), and Immigrants from Pakistan (4.9%, a difference of 0.090%).
| Demographics | Rating | Rank | Married-Couple Family Poverty |
| Immigrants | Bosnia and Herzegovina | 92.5 /100 | #125 | Exceptional 4.8% |
| Immigrants | Asia | 92.3 /100 | #126 | Exceptional 4.8% |
| Egyptians | 92.0 /100 | #127 | Exceptional 4.8% |
| Palestinians | 91.2 /100 | #128 | Exceptional 4.9% |
| Immigrants | Pakistan | 90.7 /100 | #129 | Exceptional 4.9% |
| Soviet Union | 90.7 /100 | #130 | Exceptional 4.9% |
| Immigrants | Eastern Europe | 90.5 /100 | #131 | Exceptional 4.9% |
| Puget Sound Salish | 90.4 /100 | #132 | Exceptional 4.9% |
| Immigrants | Kenya | 90.2 /100 | #133 | Exceptional 4.9% |
| Samoans | 90.2 /100 | #134 | Exceptional 4.9% |
| Assyrians/Chaldeans/Syriacs | 89.4 /100 | #135 | Excellent 4.9% |
| Immigrants | Hungary | 88.7 /100 | #136 | Excellent 4.9% |
| Guamanians/Chamorros | 86.5 /100 | #137 | Excellent 4.9% |
| Chileans | 86.0 /100 | #138 | Excellent 4.9% |
| German Russians | 85.1 /100 | #139 | Excellent 5.0% |
Demographics Similar to Iraqis by Married-Couple Family Poverty
In terms of married-couple family poverty, the demographic groups most similar to Iraqis are Cree (5.9%, a difference of 0.42%), Tsimshian (5.9%, a difference of 0.52%), Immigrants from Venezuela (5.8%, a difference of 0.62%), Immigrants from Eritrea (5.9%, a difference of 0.74%), and Immigrants from Ghana (5.9%, a difference of 0.99%).
| Demographics | Rating | Rank | Married-Couple Family Poverty |
| Fijians | 2.5 /100 | #240 | Tragic 5.8% |
| Immigrants | Panama | 2.5 /100 | #241 | Tragic 5.8% |
| Immigrants | Western Africa | 2.4 /100 | #242 | Tragic 5.8% |
| Somalis | 2.3 /100 | #243 | Tragic 5.8% |
| Chickasaw | 2.3 /100 | #244 | Tragic 5.8% |
| Immigrants | Afghanistan | 2.1 /100 | #245 | Tragic 5.8% |
| Immigrants | Venezuela | 1.8 /100 | #246 | Tragic 5.8% |
| Iraqis | 1.4 /100 | #247 | Tragic 5.9% |
| Cree | 1.2 /100 | #248 | Tragic 5.9% |
| Tsimshian | 1.1 /100 | #249 | Tragic 5.9% |
| Immigrants | Eritrea | 1.1 /100 | #250 | Tragic 5.9% |
| Immigrants | Ghana | 1.0 /100 | #251 | Tragic 5.9% |
| Immigrants | Western Asia | 0.7 /100 | #252 | Tragic 6.0% |
| Africans | 0.7 /100 | #253 | Tragic 6.0% |
| Immigrants | Somalia | 0.7 /100 | #254 | Tragic 6.0% |