Palestinian vs Immigrants from Hungary Poverty
COMPARE
Palestinian
Immigrants from Hungary
Poverty
Poverty Comparison
Palestinians
Immigrants from Hungary
11.6%
POVERTY
91.8/ 100
METRIC RATING
107th/ 347
METRIC RANK
11.7%
POVERTY
88.6/ 100
METRIC RATING
123rd/ 347
METRIC RANK
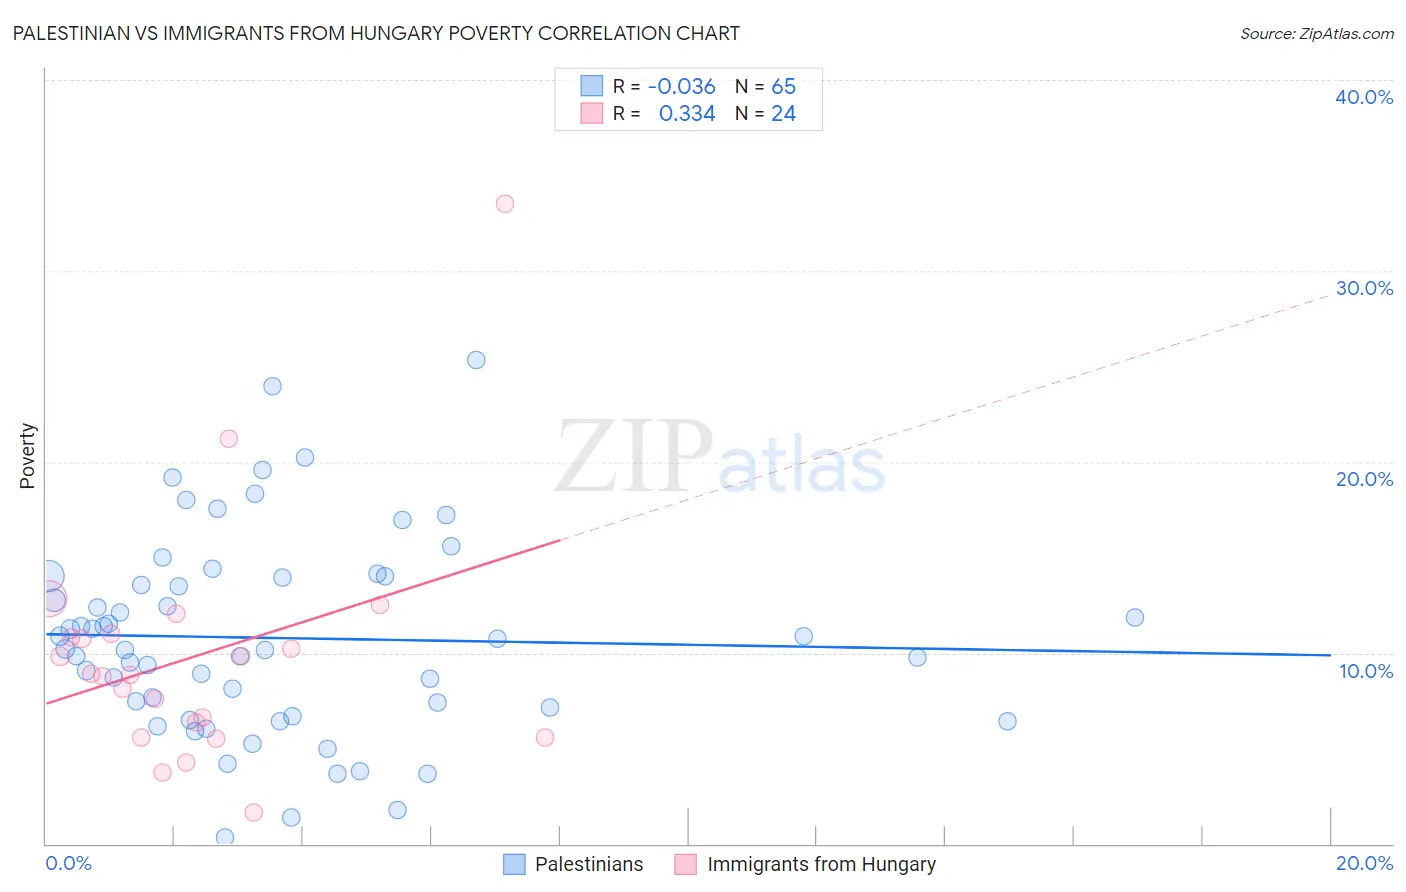
Palestinian vs Immigrants from Hungary Poverty Correlation Chart
The statistical analysis conducted on geographies consisting of 216,388,270 people shows no correlation between the proportion of Palestinians and poverty level in the United States with a correlation coefficient (R) of -0.036 and weighted average of 11.6%. Similarly, the statistical analysis conducted on geographies consisting of 195,671,774 people shows a mild positive correlation between the proportion of Immigrants from Hungary and poverty level in the United States with a correlation coefficient (R) of 0.334 and weighted average of 11.7%, a difference of 0.93%.
Poverty Correlation Summary
| Measurement | Palestinian | Immigrants from Hungary |
| Minimum | 0.32% | 1.6% |
| Maximum | 25.3% | 33.5% |
| Range | 25.0% | 31.9% |
| Mean | 10.8% | 9.8% |
| Median | 10.2% | 8.9% |
| Interquartile 25% (IQ1) | 6.9% | 6.0% |
| Interquartile 75% (IQ3) | 14.0% | 10.9% |
| Interquartile Range (IQR) | 7.0% | 4.9% |
| Standard Deviation (Sample) | 5.2% | 6.4% |
| Standard Deviation (Population) | 5.2% | 6.3% |
Demographics Similar to Palestinians and Immigrants from Hungary by Poverty
In terms of poverty, the demographic groups most similar to Palestinians are Canadian (11.6%, a difference of 0.030%), Immigrants from Turkey (11.6%, a difference of 0.050%), Portuguese (11.6%, a difference of 0.090%), Immigrants from Zimbabwe (11.6%, a difference of 0.090%), and Welsh (11.6%, a difference of 0.090%). Similarly, the demographic groups most similar to Immigrants from Hungary are New Zealander (11.7%, a difference of 0.020%), Puget Sound Salish (11.7%, a difference of 0.020%), Soviet Union (11.7%, a difference of 0.070%), Immigrants from South Eastern Asia (11.7%, a difference of 0.080%), and Tlingit-Haida (11.7%, a difference of 0.090%).
| Demographics | Rating | Rank | Poverty |
| Portuguese | 92.1 /100 | #105 | Exceptional 11.6% |
| Immigrants | Zimbabwe | 92.1 /100 | #106 | Exceptional 11.6% |
| Palestinians | 91.8 /100 | #107 | Exceptional 11.6% |
| Canadians | 91.7 /100 | #108 | Exceptional 11.6% |
| Immigrants | Turkey | 91.7 /100 | #109 | Exceptional 11.6% |
| Welsh | 91.6 /100 | #110 | Exceptional 11.6% |
| French Canadians | 91.0 /100 | #111 | Exceptional 11.6% |
| Immigrants | Southern Europe | 90.8 /100 | #112 | Exceptional 11.6% |
| Immigrants | Belarus | 90.8 /100 | #113 | Exceptional 11.6% |
| Immigrants | China | 90.7 /100 | #114 | Exceptional 11.6% |
| Albanians | 90.3 /100 | #115 | Exceptional 11.7% |
| Immigrants | Russia | 89.7 /100 | #116 | Excellent 11.7% |
| Sri Lankans | 89.4 /100 | #117 | Excellent 11.7% |
| Argentineans | 89.1 /100 | #118 | Excellent 11.7% |
| Tlingit-Haida | 89.0 /100 | #119 | Excellent 11.7% |
| Immigrants | South Eastern Asia | 88.9 /100 | #120 | Excellent 11.7% |
| New Zealanders | 88.7 /100 | #121 | Excellent 11.7% |
| Puget Sound Salish | 88.7 /100 | #122 | Excellent 11.7% |
| Immigrants | Hungary | 88.6 /100 | #123 | Excellent 11.7% |
| Soviet Union | 88.4 /100 | #124 | Excellent 11.7% |
| Immigrants | Brazil | 88.2 /100 | #125 | Excellent 11.7% |