Palestinian vs Immigrants from Portugal Poverty
COMPARE
Palestinian
Immigrants from Portugal
Poverty
Poverty Comparison
Palestinians
Immigrants from Portugal
11.6%
POVERTY
91.8/ 100
METRIC RATING
107th/ 347
METRIC RANK
12.3%
POVERTY
50.5/ 100
METRIC RATING
172nd/ 347
METRIC RANK
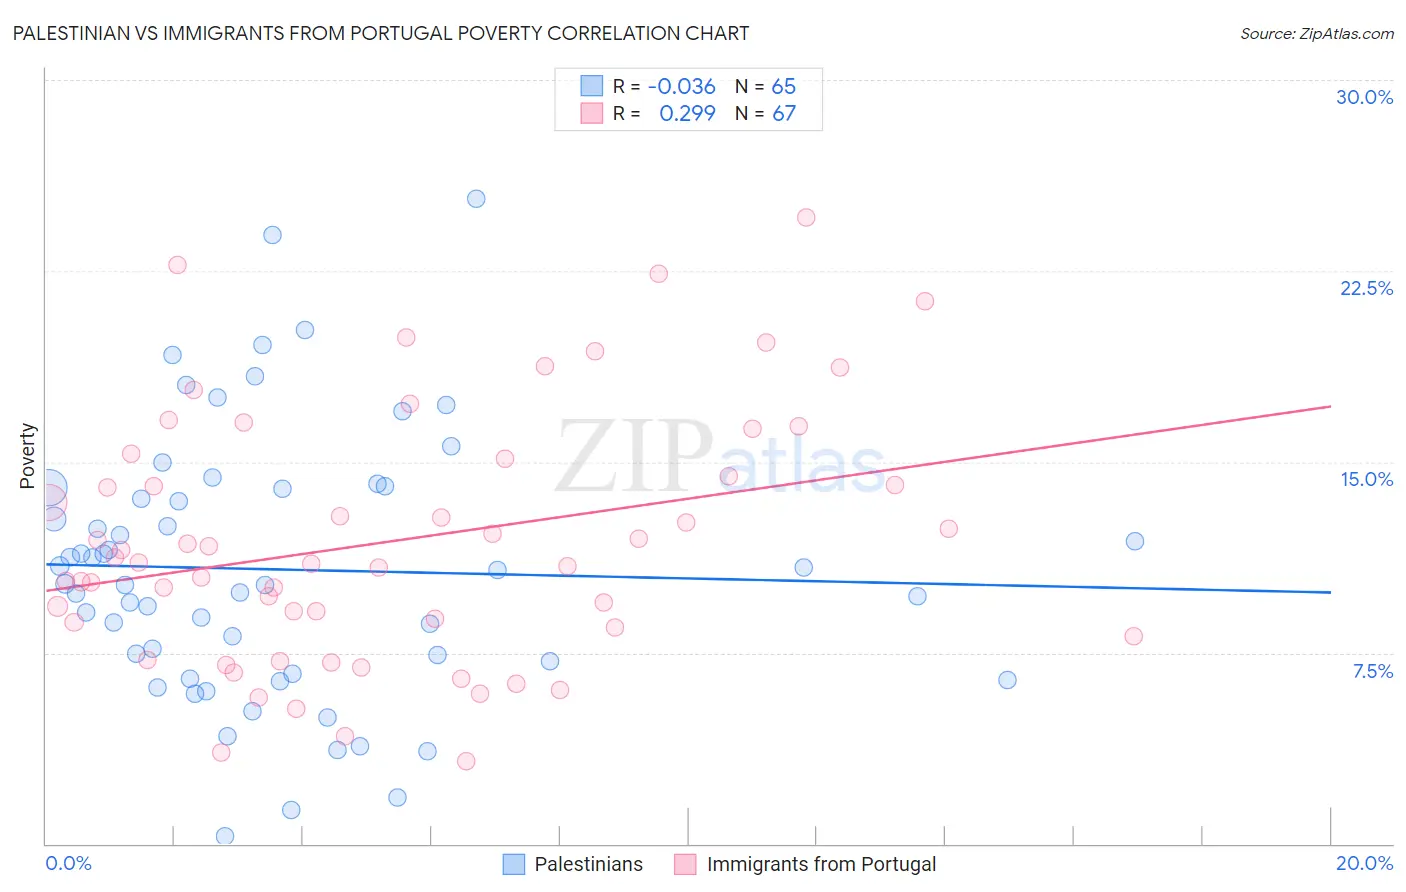
Palestinian vs Immigrants from Portugal Poverty Correlation Chart
The statistical analysis conducted on geographies consisting of 216,388,270 people shows no correlation between the proportion of Palestinians and poverty level in the United States with a correlation coefficient (R) of -0.036 and weighted average of 11.6%. Similarly, the statistical analysis conducted on geographies consisting of 174,738,655 people shows a weak positive correlation between the proportion of Immigrants from Portugal and poverty level in the United States with a correlation coefficient (R) of 0.299 and weighted average of 12.3%, a difference of 6.2%.
Poverty Correlation Summary
| Measurement | Palestinian | Immigrants from Portugal |
| Minimum | 0.32% | 3.3% |
| Maximum | 25.3% | 24.6% |
| Range | 25.0% | 21.3% |
| Mean | 10.8% | 11.9% |
| Median | 10.2% | 11.0% |
| Interquartile 25% (IQ1) | 6.9% | 8.5% |
| Interquartile 75% (IQ3) | 14.0% | 15.1% |
| Interquartile Range (IQR) | 7.0% | 6.6% |
| Standard Deviation (Sample) | 5.2% | 4.9% |
| Standard Deviation (Population) | 5.2% | 4.9% |
Similar Demographics by Poverty
Demographics Similar to Palestinians by Poverty
In terms of poverty, the demographic groups most similar to Palestinians are Canadian (11.6%, a difference of 0.030%), Immigrants from Turkey (11.6%, a difference of 0.050%), Portuguese (11.6%, a difference of 0.090%), Immigrants from Zimbabwe (11.6%, a difference of 0.090%), and Welsh (11.6%, a difference of 0.090%).
| Demographics | Rating | Rank | Poverty |
| Scottish | 94.0 /100 | #100 | Exceptional 11.5% |
| Slavs | 93.3 /100 | #101 | Exceptional 11.5% |
| Laotians | 92.4 /100 | #102 | Exceptional 11.6% |
| Okinawans | 92.4 /100 | #103 | Exceptional 11.6% |
| Native Hawaiians | 92.1 /100 | #104 | Exceptional 11.6% |
| Portuguese | 92.1 /100 | #105 | Exceptional 11.6% |
| Immigrants | Zimbabwe | 92.1 /100 | #106 | Exceptional 11.6% |
| Palestinians | 91.8 /100 | #107 | Exceptional 11.6% |
| Canadians | 91.7 /100 | #108 | Exceptional 11.6% |
| Immigrants | Turkey | 91.7 /100 | #109 | Exceptional 11.6% |
| Welsh | 91.6 /100 | #110 | Exceptional 11.6% |
| French Canadians | 91.0 /100 | #111 | Exceptional 11.6% |
| Immigrants | Southern Europe | 90.8 /100 | #112 | Exceptional 11.6% |
| Immigrants | Belarus | 90.8 /100 | #113 | Exceptional 11.6% |
| Immigrants | China | 90.7 /100 | #114 | Exceptional 11.6% |
Demographics Similar to Immigrants from Portugal by Poverty
In terms of poverty, the demographic groups most similar to Immigrants from Portugal are Celtic (12.3%, a difference of 0.040%), Lebanese (12.3%, a difference of 0.050%), Immigrants from Spain (12.3%, a difference of 0.070%), South American (12.3%, a difference of 0.18%), and Immigrants from Colombia (12.3%, a difference of 0.28%).
| Demographics | Rating | Rank | Poverty |
| Immigrants | Albania | 57.7 /100 | #165 | Average 12.2% |
| Venezuelans | 56.9 /100 | #166 | Average 12.2% |
| Immigrants | Chile | 56.7 /100 | #167 | Average 12.2% |
| Immigrants | Venezuela | 56.5 /100 | #168 | Average 12.2% |
| Whites/Caucasians | 55.4 /100 | #169 | Average 12.3% |
| Immigrants | Oceania | 54.6 /100 | #170 | Average 12.3% |
| Immigrants | Spain | 51.3 /100 | #171 | Average 12.3% |
| Immigrants | Portugal | 50.5 /100 | #172 | Average 12.3% |
| Celtics | 50.1 /100 | #173 | Average 12.3% |
| Lebanese | 50.0 /100 | #174 | Average 12.3% |
| South Americans | 48.7 /100 | #175 | Average 12.3% |
| Immigrants | Colombia | 47.7 /100 | #176 | Average 12.3% |
| Immigrants | Syria | 47.5 /100 | #177 | Average 12.3% |
| Uruguayans | 44.7 /100 | #178 | Average 12.4% |
| Immigrants | Morocco | 44.0 /100 | #179 | Average 12.4% |