Palestinian vs Immigrants from Sierra Leone Poverty
COMPARE
Palestinian
Immigrants from Sierra Leone
Poverty
Poverty Comparison
Palestinians
Immigrants from Sierra Leone
11.6%
POVERTY
91.8/ 100
METRIC RATING
107th/ 347
METRIC RANK
12.5%
POVERTY
36.3/ 100
METRIC RATING
186th/ 347
METRIC RANK
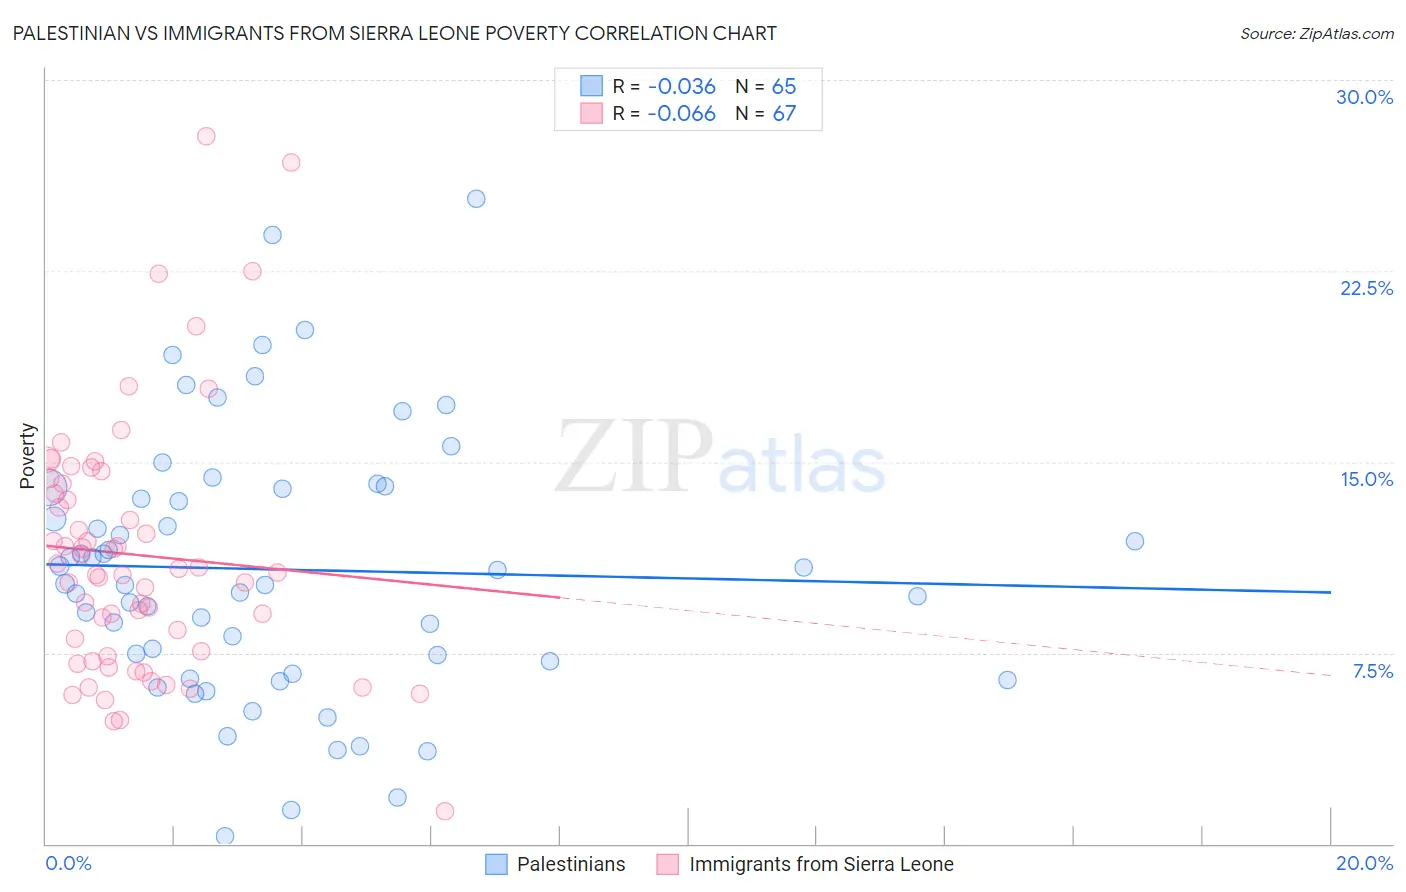
Palestinian vs Immigrants from Sierra Leone Poverty Correlation Chart
The statistical analysis conducted on geographies consisting of 216,388,270 people shows no correlation between the proportion of Palestinians and poverty level in the United States with a correlation coefficient (R) of -0.036 and weighted average of 11.6%. Similarly, the statistical analysis conducted on geographies consisting of 101,642,850 people shows a slight negative correlation between the proportion of Immigrants from Sierra Leone and poverty level in the United States with a correlation coefficient (R) of -0.066 and weighted average of 12.5%, a difference of 7.7%.
Poverty Correlation Summary
| Measurement | Palestinian | Immigrants from Sierra Leone |
| Minimum | 0.32% | 1.3% |
| Maximum | 25.3% | 27.8% |
| Range | 25.0% | 26.5% |
| Mean | 10.8% | 11.3% |
| Median | 10.2% | 10.6% |
| Interquartile 25% (IQ1) | 6.9% | 7.4% |
| Interquartile 75% (IQ3) | 14.0% | 14.2% |
| Interquartile Range (IQR) | 7.0% | 6.8% |
| Standard Deviation (Sample) | 5.2% | 5.0% |
| Standard Deviation (Population) | 5.2% | 5.0% |
Similar Demographics by Poverty
Demographics Similar to Palestinians by Poverty
In terms of poverty, the demographic groups most similar to Palestinians are Canadian (11.6%, a difference of 0.030%), Immigrants from Turkey (11.6%, a difference of 0.050%), Portuguese (11.6%, a difference of 0.090%), Immigrants from Zimbabwe (11.6%, a difference of 0.090%), and Welsh (11.6%, a difference of 0.090%).
| Demographics | Rating | Rank | Poverty |
| Scottish | 94.0 /100 | #100 | Exceptional 11.5% |
| Slavs | 93.3 /100 | #101 | Exceptional 11.5% |
| Laotians | 92.4 /100 | #102 | Exceptional 11.6% |
| Okinawans | 92.4 /100 | #103 | Exceptional 11.6% |
| Native Hawaiians | 92.1 /100 | #104 | Exceptional 11.6% |
| Portuguese | 92.1 /100 | #105 | Exceptional 11.6% |
| Immigrants | Zimbabwe | 92.1 /100 | #106 | Exceptional 11.6% |
| Palestinians | 91.8 /100 | #107 | Exceptional 11.6% |
| Canadians | 91.7 /100 | #108 | Exceptional 11.6% |
| Immigrants | Turkey | 91.7 /100 | #109 | Exceptional 11.6% |
| Welsh | 91.6 /100 | #110 | Exceptional 11.6% |
| French Canadians | 91.0 /100 | #111 | Exceptional 11.6% |
| Immigrants | Southern Europe | 90.8 /100 | #112 | Exceptional 11.6% |
| Immigrants | Belarus | 90.8 /100 | #113 | Exceptional 11.6% |
| Immigrants | China | 90.7 /100 | #114 | Exceptional 11.6% |
Demographics Similar to Immigrants from Sierra Leone by Poverty
In terms of poverty, the demographic groups most similar to Immigrants from Sierra Leone are Israeli (12.5%, a difference of 0.020%), Hawaiian (12.5%, a difference of 0.23%), Kenyan (12.5%, a difference of 0.26%), Immigrants from Costa Rica (12.5%, a difference of 0.32%), and Aleut (12.5%, a difference of 0.32%).
| Demographics | Rating | Rank | Poverty |
| Immigrants | Morocco | 44.0 /100 | #179 | Average 12.4% |
| Mongolians | 43.6 /100 | #180 | Average 12.4% |
| Immigrants | Afghanistan | 42.1 /100 | #181 | Average 12.4% |
| Immigrants | Cameroon | 41.7 /100 | #182 | Average 12.4% |
| Immigrants | Iraq | 40.2 /100 | #183 | Average 12.4% |
| Kenyans | 38.8 /100 | #184 | Fair 12.5% |
| Israelis | 36.4 /100 | #185 | Fair 12.5% |
| Immigrants | Sierra Leone | 36.3 /100 | #186 | Fair 12.5% |
| Hawaiians | 34.1 /100 | #187 | Fair 12.5% |
| Immigrants | Costa Rica | 33.3 /100 | #188 | Fair 12.5% |
| Aleuts | 33.2 /100 | #189 | Fair 12.5% |
| Immigrants | South America | 32.3 /100 | #190 | Fair 12.5% |
| Sierra Leoneans | 31.5 /100 | #191 | Fair 12.6% |
| South American Indians | 23.3 /100 | #192 | Fair 12.7% |
| Delaware | 21.4 /100 | #193 | Fair 12.7% |