Palestinian vs Immigrants from Guatemala Poverty
COMPARE
Palestinian
Immigrants from Guatemala
Poverty
Poverty Comparison
Palestinians
Immigrants from Guatemala
11.6%
POVERTY
91.8/ 100
METRIC RATING
107th/ 347
METRIC RANK
15.5%
POVERTY
0.0/ 100
METRIC RATING
305th/ 347
METRIC RANK
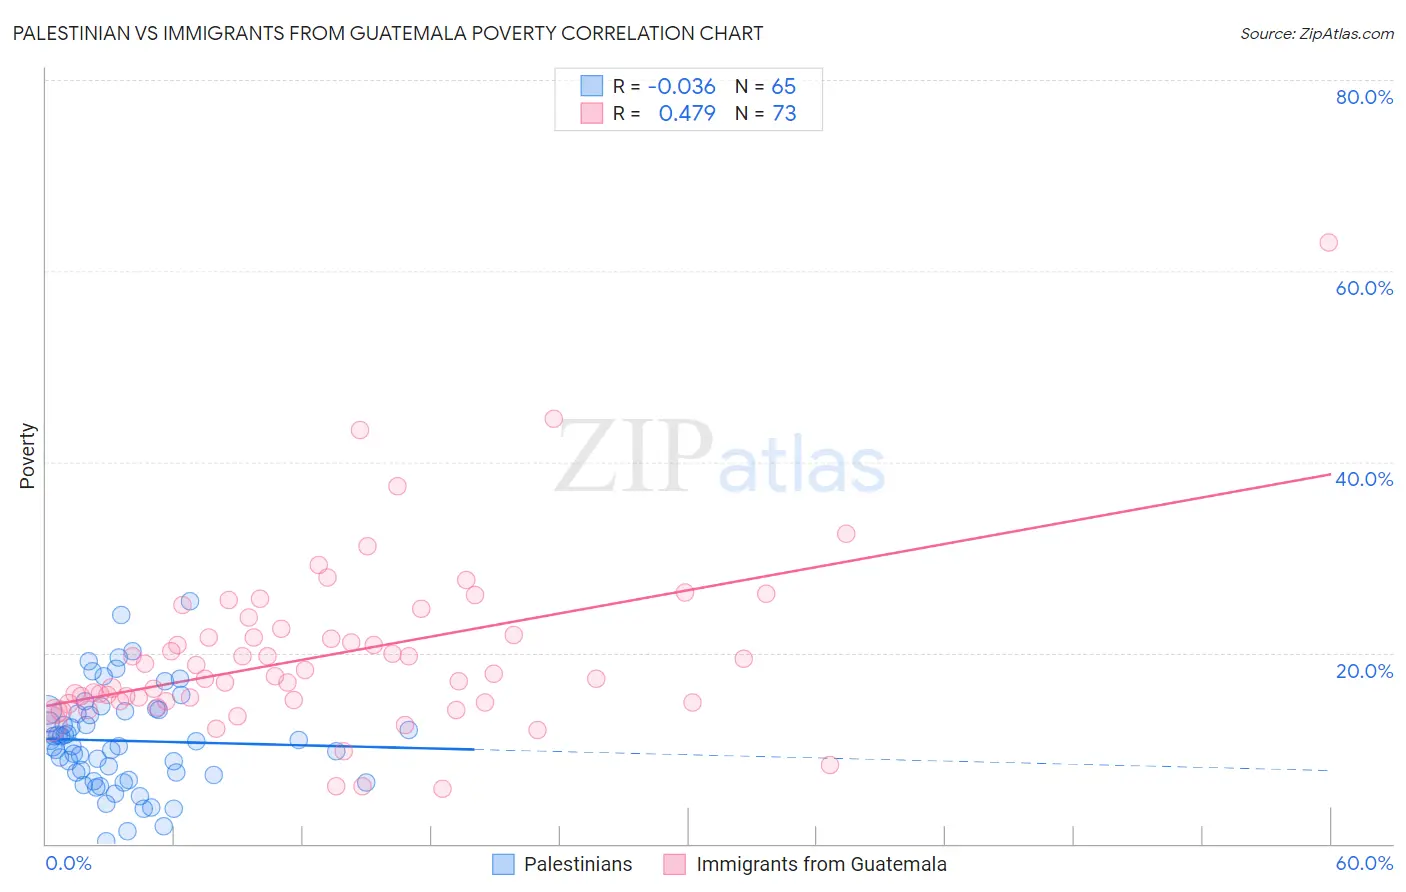
Palestinian vs Immigrants from Guatemala Poverty Correlation Chart
The statistical analysis conducted on geographies consisting of 216,388,270 people shows no correlation between the proportion of Palestinians and poverty level in the United States with a correlation coefficient (R) of -0.036 and weighted average of 11.6%. Similarly, the statistical analysis conducted on geographies consisting of 377,145,894 people shows a moderate positive correlation between the proportion of Immigrants from Guatemala and poverty level in the United States with a correlation coefficient (R) of 0.479 and weighted average of 15.5%, a difference of 33.7%.
Poverty Correlation Summary
| Measurement | Palestinian | Immigrants from Guatemala |
| Minimum | 0.32% | 5.8% |
| Maximum | 25.3% | 62.9% |
| Range | 25.0% | 57.2% |
| Mean | 10.8% | 19.7% |
| Median | 10.2% | 17.5% |
| Interquartile 25% (IQ1) | 6.9% | 14.8% |
| Interquartile 75% (IQ3) | 14.0% | 22.2% |
| Interquartile Range (IQR) | 7.0% | 7.3% |
| Standard Deviation (Sample) | 5.2% | 8.9% |
| Standard Deviation (Population) | 5.2% | 8.9% |
Similar Demographics by Poverty
Demographics Similar to Palestinians by Poverty
In terms of poverty, the demographic groups most similar to Palestinians are Canadian (11.6%, a difference of 0.030%), Immigrants from Turkey (11.6%, a difference of 0.050%), Portuguese (11.6%, a difference of 0.090%), Immigrants from Zimbabwe (11.6%, a difference of 0.090%), and Welsh (11.6%, a difference of 0.090%).
| Demographics | Rating | Rank | Poverty |
| Scottish | 94.0 /100 | #100 | Exceptional 11.5% |
| Slavs | 93.3 /100 | #101 | Exceptional 11.5% |
| Laotians | 92.4 /100 | #102 | Exceptional 11.6% |
| Okinawans | 92.4 /100 | #103 | Exceptional 11.6% |
| Native Hawaiians | 92.1 /100 | #104 | Exceptional 11.6% |
| Portuguese | 92.1 /100 | #105 | Exceptional 11.6% |
| Immigrants | Zimbabwe | 92.1 /100 | #106 | Exceptional 11.6% |
| Palestinians | 91.8 /100 | #107 | Exceptional 11.6% |
| Canadians | 91.7 /100 | #108 | Exceptional 11.6% |
| Immigrants | Turkey | 91.7 /100 | #109 | Exceptional 11.6% |
| Welsh | 91.6 /100 | #110 | Exceptional 11.6% |
| French Canadians | 91.0 /100 | #111 | Exceptional 11.6% |
| Immigrants | Southern Europe | 90.8 /100 | #112 | Exceptional 11.6% |
| Immigrants | Belarus | 90.8 /100 | #113 | Exceptional 11.6% |
| Immigrants | China | 90.7 /100 | #114 | Exceptional 11.6% |
Demographics Similar to Immigrants from Guatemala by Poverty
In terms of poverty, the demographic groups most similar to Immigrants from Guatemala are Immigrants from Mexico (15.5%, a difference of 0.030%), Immigrants from Caribbean (15.5%, a difference of 0.12%), Creek (15.6%, a difference of 0.44%), African (15.6%, a difference of 0.51%), and Somali (15.4%, a difference of 0.61%).
| Demographics | Rating | Rank | Poverty |
| Immigrants | Senegal | 0.0 /100 | #298 | Tragic 15.3% |
| Senegalese | 0.0 /100 | #299 | Tragic 15.3% |
| Immigrants | Central America | 0.0 /100 | #300 | Tragic 15.4% |
| Bahamians | 0.0 /100 | #301 | Tragic 15.4% |
| Somalis | 0.0 /100 | #302 | Tragic 15.4% |
| Immigrants | Caribbean | 0.0 /100 | #303 | Tragic 15.5% |
| Immigrants | Mexico | 0.0 /100 | #304 | Tragic 15.5% |
| Immigrants | Guatemala | 0.0 /100 | #305 | Tragic 15.5% |
| Creek | 0.0 /100 | #306 | Tragic 15.6% |
| Africans | 0.0 /100 | #307 | Tragic 15.6% |
| Choctaw | 0.0 /100 | #308 | Tragic 15.6% |
| Seminole | 0.0 /100 | #309 | Tragic 15.6% |
| Dutch West Indians | 0.0 /100 | #310 | Tragic 15.6% |
| Chippewa | 0.0 /100 | #311 | Tragic 15.7% |
| Cajuns | 0.0 /100 | #312 | Tragic 15.7% |