Palestinian vs Kenyan Poverty
COMPARE
Palestinian
Kenyan
Poverty
Poverty Comparison
Palestinians
Kenyans
11.6%
POVERTY
91.8/ 100
METRIC RATING
107th/ 347
METRIC RANK
12.5%
POVERTY
38.8/ 100
METRIC RATING
184th/ 347
METRIC RANK
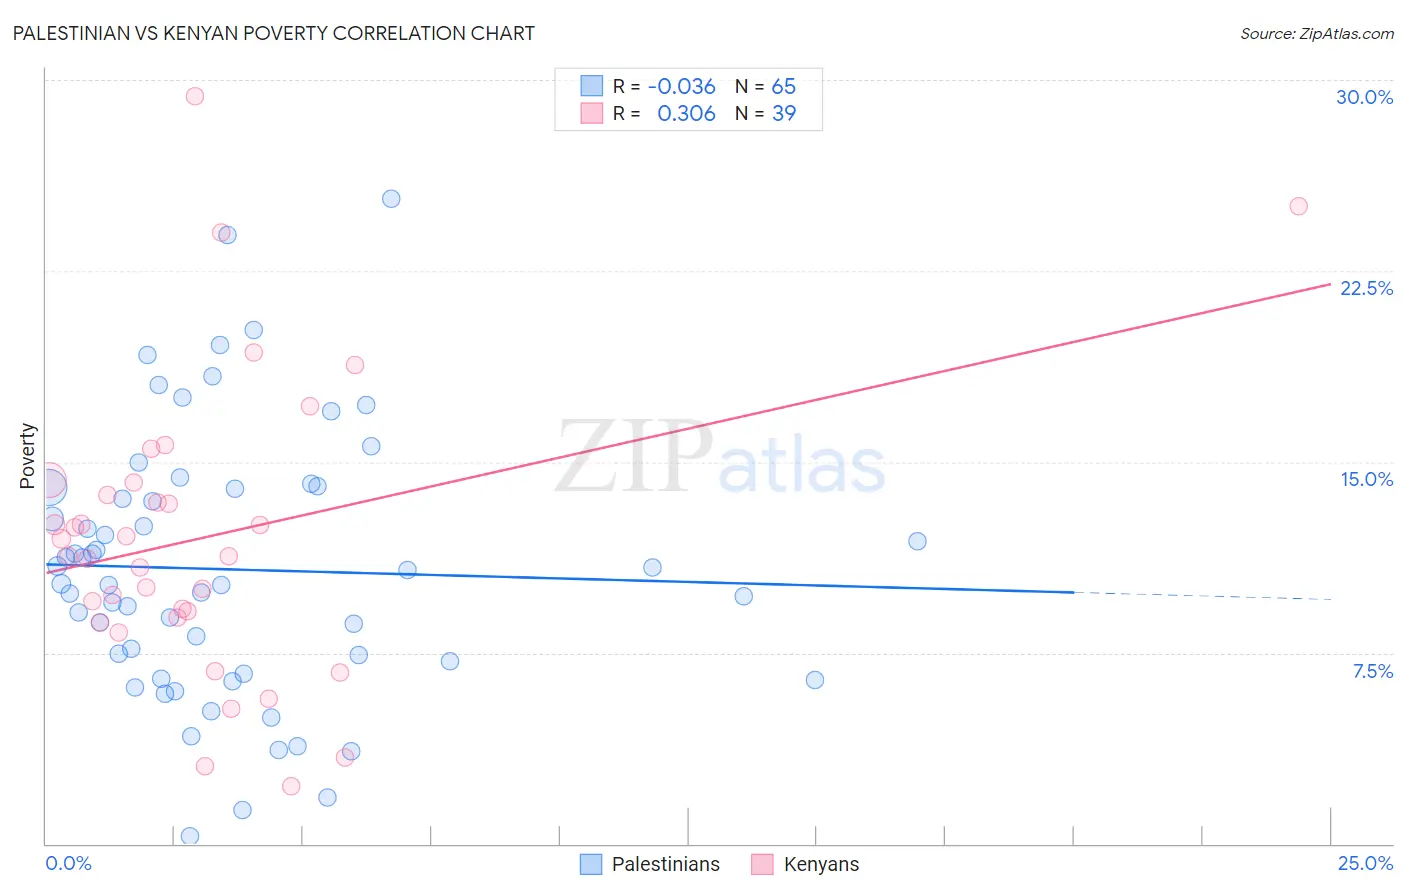
Palestinian vs Kenyan Poverty Correlation Chart
The statistical analysis conducted on geographies consisting of 216,388,270 people shows no correlation between the proportion of Palestinians and poverty level in the United States with a correlation coefficient (R) of -0.036 and weighted average of 11.6%. Similarly, the statistical analysis conducted on geographies consisting of 168,174,579 people shows a mild positive correlation between the proportion of Kenyans and poverty level in the United States with a correlation coefficient (R) of 0.306 and weighted average of 12.5%, a difference of 7.4%.
Poverty Correlation Summary
| Measurement | Palestinian | Kenyan |
| Minimum | 0.32% | 2.2% |
| Maximum | 25.3% | 29.3% |
| Range | 25.0% | 27.1% |
| Mean | 10.8% | 12.0% |
| Median | 10.2% | 11.3% |
| Interquartile 25% (IQ1) | 6.9% | 8.9% |
| Interquartile 75% (IQ3) | 14.0% | 14.2% |
| Interquartile Range (IQR) | 7.0% | 5.3% |
| Standard Deviation (Sample) | 5.2% | 5.7% |
| Standard Deviation (Population) | 5.2% | 5.7% |
Similar Demographics by Poverty
Demographics Similar to Palestinians by Poverty
In terms of poverty, the demographic groups most similar to Palestinians are Canadian (11.6%, a difference of 0.030%), Immigrants from Turkey (11.6%, a difference of 0.050%), Portuguese (11.6%, a difference of 0.090%), Immigrants from Zimbabwe (11.6%, a difference of 0.090%), and Welsh (11.6%, a difference of 0.090%).
| Demographics | Rating | Rank | Poverty |
| Scottish | 94.0 /100 | #100 | Exceptional 11.5% |
| Slavs | 93.3 /100 | #101 | Exceptional 11.5% |
| Laotians | 92.4 /100 | #102 | Exceptional 11.6% |
| Okinawans | 92.4 /100 | #103 | Exceptional 11.6% |
| Native Hawaiians | 92.1 /100 | #104 | Exceptional 11.6% |
| Portuguese | 92.1 /100 | #105 | Exceptional 11.6% |
| Immigrants | Zimbabwe | 92.1 /100 | #106 | Exceptional 11.6% |
| Palestinians | 91.8 /100 | #107 | Exceptional 11.6% |
| Canadians | 91.7 /100 | #108 | Exceptional 11.6% |
| Immigrants | Turkey | 91.7 /100 | #109 | Exceptional 11.6% |
| Welsh | 91.6 /100 | #110 | Exceptional 11.6% |
| French Canadians | 91.0 /100 | #111 | Exceptional 11.6% |
| Immigrants | Southern Europe | 90.8 /100 | #112 | Exceptional 11.6% |
| Immigrants | Belarus | 90.8 /100 | #113 | Exceptional 11.6% |
| Immigrants | China | 90.7 /100 | #114 | Exceptional 11.6% |
Demographics Similar to Kenyans by Poverty
In terms of poverty, the demographic groups most similar to Kenyans are Immigrants from Iraq (12.4%, a difference of 0.13%), Israeli (12.5%, a difference of 0.24%), Immigrants from Sierra Leone (12.5%, a difference of 0.26%), Immigrants from Cameroon (12.4%, a difference of 0.29%), and Immigrants from Afghanistan (12.4%, a difference of 0.33%).
| Demographics | Rating | Rank | Poverty |
| Immigrants | Syria | 47.5 /100 | #177 | Average 12.3% |
| Uruguayans | 44.7 /100 | #178 | Average 12.4% |
| Immigrants | Morocco | 44.0 /100 | #179 | Average 12.4% |
| Mongolians | 43.6 /100 | #180 | Average 12.4% |
| Immigrants | Afghanistan | 42.1 /100 | #181 | Average 12.4% |
| Immigrants | Cameroon | 41.7 /100 | #182 | Average 12.4% |
| Immigrants | Iraq | 40.2 /100 | #183 | Average 12.4% |
| Kenyans | 38.8 /100 | #184 | Fair 12.5% |
| Israelis | 36.4 /100 | #185 | Fair 12.5% |
| Immigrants | Sierra Leone | 36.3 /100 | #186 | Fair 12.5% |
| Hawaiians | 34.1 /100 | #187 | Fair 12.5% |
| Immigrants | Costa Rica | 33.3 /100 | #188 | Fair 12.5% |
| Aleuts | 33.2 /100 | #189 | Fair 12.5% |
| Immigrants | South America | 32.3 /100 | #190 | Fair 12.5% |
| Sierra Leoneans | 31.5 /100 | #191 | Fair 12.6% |