Cambodian vs Immigrants from Hungary Poverty
COMPARE
Cambodian
Immigrants from Hungary
Poverty
Poverty Comparison
Cambodians
Immigrants from Hungary
11.3%
POVERTY
96.7/ 100
METRIC RATING
79th/ 347
METRIC RANK
11.7%
POVERTY
88.6/ 100
METRIC RATING
123rd/ 347
METRIC RANK
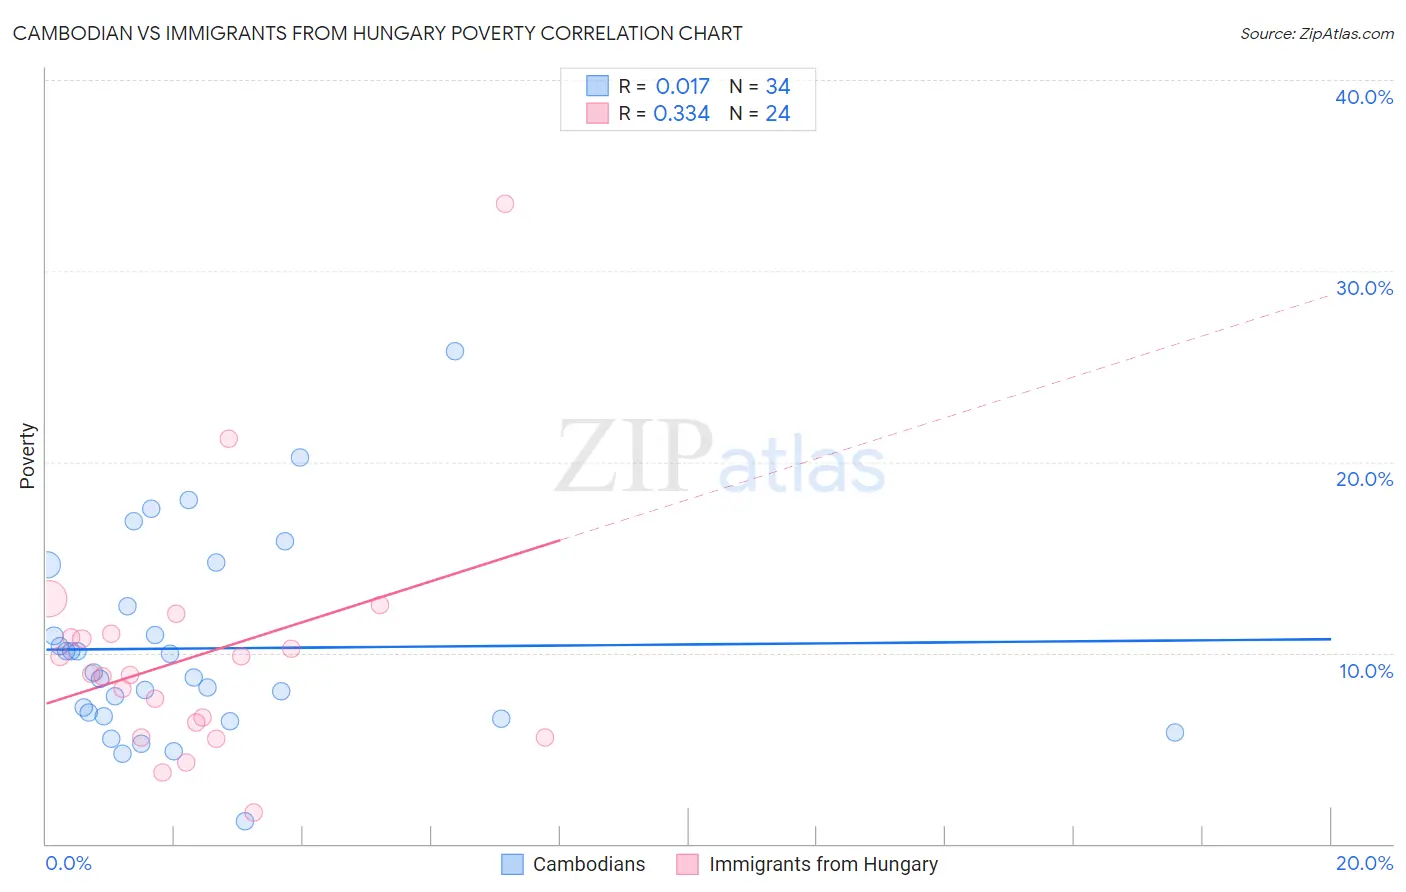
Cambodian vs Immigrants from Hungary Poverty Correlation Chart
The statistical analysis conducted on geographies consisting of 102,491,880 people shows no correlation between the proportion of Cambodians and poverty level in the United States with a correlation coefficient (R) of 0.017 and weighted average of 11.3%. Similarly, the statistical analysis conducted on geographies consisting of 195,671,774 people shows a mild positive correlation between the proportion of Immigrants from Hungary and poverty level in the United States with a correlation coefficient (R) of 0.334 and weighted average of 11.7%, a difference of 3.5%.
Poverty Correlation Summary
| Measurement | Cambodian | Immigrants from Hungary |
| Minimum | 1.2% | 1.6% |
| Maximum | 25.8% | 33.5% |
| Range | 24.6% | 31.9% |
| Mean | 10.2% | 9.8% |
| Median | 8.8% | 8.9% |
| Interquartile 25% (IQ1) | 6.7% | 6.0% |
| Interquartile 75% (IQ3) | 12.4% | 10.9% |
| Interquartile Range (IQR) | 5.7% | 4.9% |
| Standard Deviation (Sample) | 5.1% | 6.4% |
| Standard Deviation (Population) | 5.1% | 6.3% |
Similar Demographics by Poverty
Demographics Similar to Cambodians by Poverty
In terms of poverty, the demographic groups most similar to Cambodians are Indian (Asian) (11.3%, a difference of 0.020%), Irish (11.3%, a difference of 0.020%), Dutch (11.3%, a difference of 0.040%), Immigrants from Eastern Asia (11.3%, a difference of 0.060%), and Egyptian (11.3%, a difference of 0.12%).
| Demographics | Rating | Rank | Poverty |
| Europeans | 97.2 /100 | #72 | Exceptional 11.3% |
| Immigrants | Belgium | 97.2 /100 | #73 | Exceptional 11.3% |
| Carpatho Rusyns | 97.2 /100 | #74 | Exceptional 11.3% |
| Immigrants | Eastern Europe | 97.0 /100 | #75 | Exceptional 11.3% |
| Immigrants | North America | 96.8 /100 | #76 | Exceptional 11.3% |
| Immigrants | Eastern Asia | 96.7 /100 | #77 | Exceptional 11.3% |
| Dutch | 96.7 /100 | #78 | Exceptional 11.3% |
| Cambodians | 96.7 /100 | #79 | Exceptional 11.3% |
| Indians (Asian) | 96.6 /100 | #80 | Exceptional 11.3% |
| Irish | 96.6 /100 | #81 | Exceptional 11.3% |
| Egyptians | 96.5 /100 | #82 | Exceptional 11.3% |
| Immigrants | Sweden | 96.3 /100 | #83 | Exceptional 11.3% |
| English | 96.3 /100 | #84 | Exceptional 11.3% |
| Immigrants | England | 96.2 /100 | #85 | Exceptional 11.4% |
| Jordanians | 96.0 /100 | #86 | Exceptional 11.4% |
Demographics Similar to Immigrants from Hungary by Poverty
In terms of poverty, the demographic groups most similar to Immigrants from Hungary are New Zealander (11.7%, a difference of 0.020%), Puget Sound Salish (11.7%, a difference of 0.020%), Soviet Union (11.7%, a difference of 0.070%), Immigrants from South Eastern Asia (11.7%, a difference of 0.080%), and Tlingit-Haida (11.7%, a difference of 0.090%).
| Demographics | Rating | Rank | Poverty |
| Immigrants | Russia | 89.7 /100 | #116 | Excellent 11.7% |
| Sri Lankans | 89.4 /100 | #117 | Excellent 11.7% |
| Argentineans | 89.1 /100 | #118 | Excellent 11.7% |
| Tlingit-Haida | 89.0 /100 | #119 | Excellent 11.7% |
| Immigrants | South Eastern Asia | 88.9 /100 | #120 | Excellent 11.7% |
| New Zealanders | 88.7 /100 | #121 | Excellent 11.7% |
| Puget Sound Salish | 88.7 /100 | #122 | Excellent 11.7% |
| Immigrants | Hungary | 88.6 /100 | #123 | Excellent 11.7% |
| Soviet Union | 88.4 /100 | #124 | Excellent 11.7% |
| Immigrants | Brazil | 88.2 /100 | #125 | Excellent 11.7% |
| Immigrants | Norway | 88.0 /100 | #126 | Excellent 11.7% |
| Immigrants | Argentina | 88.0 /100 | #127 | Excellent 11.7% |
| Immigrants | Israel | 87.4 /100 | #128 | Excellent 11.7% |
| South Africans | 87.0 /100 | #129 | Excellent 11.7% |
| Immigrants | Ukraine | 86.6 /100 | #130 | Excellent 11.8% |