Palestinian vs Immigrants from Hungary Median Female Earnings
COMPARE
Palestinian
Immigrants from Hungary
Median Female Earnings
Median Female Earnings Comparison
Palestinians
Immigrants from Hungary
$41,484
MEDIAN FEMALE EARNINGS
97.6/ 100
METRIC RATING
107th/ 347
METRIC RANK
$41,820
MEDIAN FEMALE EARNINGS
98.8/ 100
METRIC RATING
97th/ 347
METRIC RANK
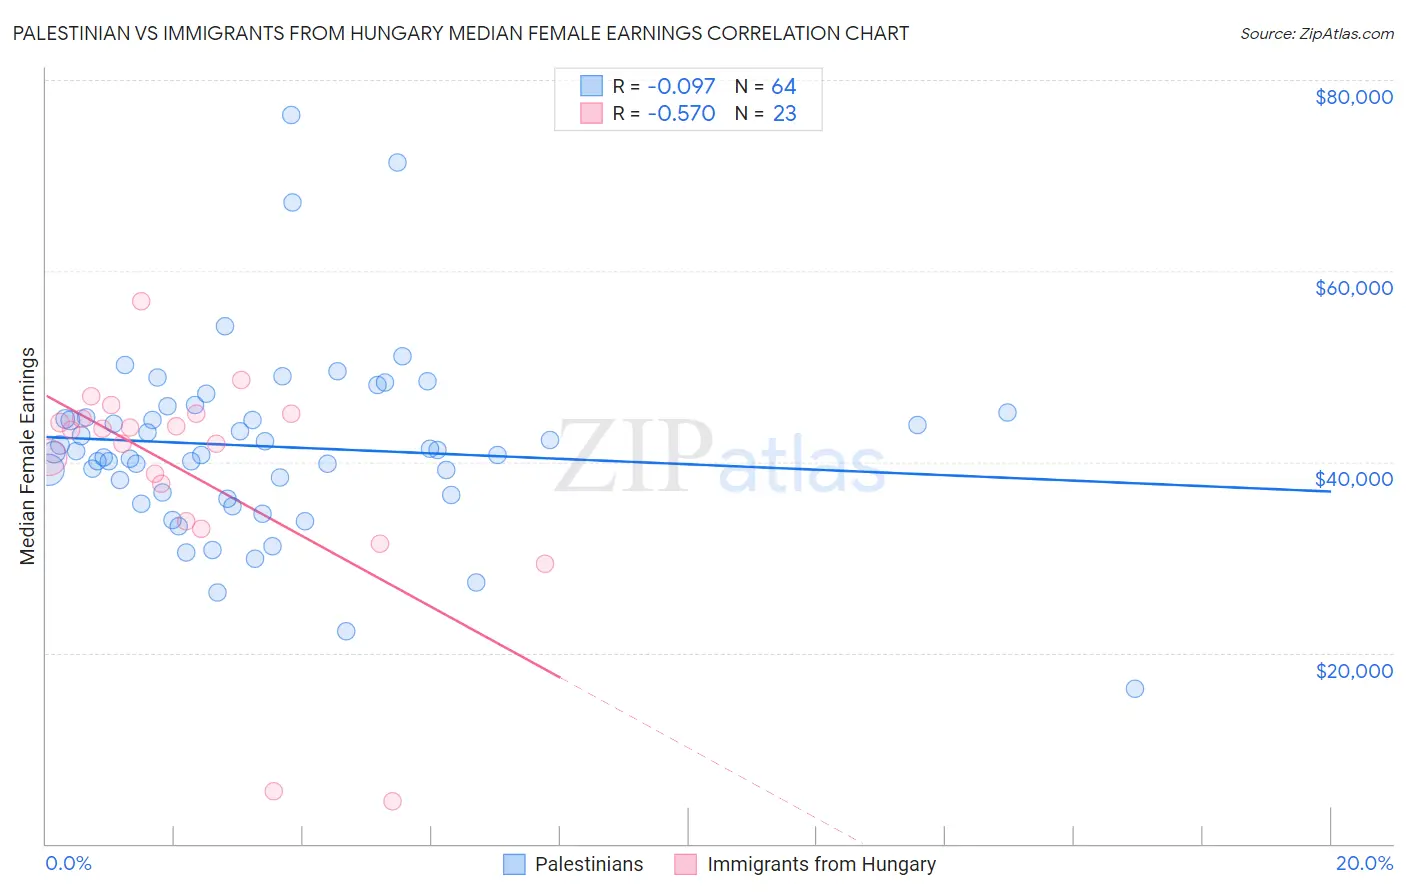
Palestinian vs Immigrants from Hungary Median Female Earnings Correlation Chart
The statistical analysis conducted on geographies consisting of 216,451,801 people shows a slight negative correlation between the proportion of Palestinians and median female earnings in the United States with a correlation coefficient (R) of -0.097 and weighted average of $41,484. Similarly, the statistical analysis conducted on geographies consisting of 195,658,661 people shows a substantial negative correlation between the proportion of Immigrants from Hungary and median female earnings in the United States with a correlation coefficient (R) of -0.570 and weighted average of $41,820, a difference of 0.81%.
Median Female Earnings Correlation Summary
| Measurement | Palestinian | Immigrants from Hungary |
| Minimum | $16,250 | $4,461 |
| Maximum | $76,295 | $56,794 |
| Range | $60,045 | $52,333 |
| Mean | $41,606 | $38,664 |
| Median | $41,078 | $43,380 |
| Interquartile 25% (IQ1) | $36,652 | $33,775 |
| Interquartile 75% (IQ3) | $44,886 | $45,019 |
| Interquartile Range (IQR) | $8,234 | $11,243 |
| Standard Deviation (Sample) | $9,677 | $12,200 |
| Standard Deviation (Population) | $9,602 | $11,932 |
Demographics Similar to Palestinians and Immigrants from Hungary by Median Female Earnings
In terms of median female earnings, the demographic groups most similar to Palestinians are Immigrants from Eritrea ($41,485, a difference of 0.0%), Italian ($41,505, a difference of 0.050%), Jordanian ($41,464, a difference of 0.050%), Chinese ($41,461, a difference of 0.050%), and Immigrants from Zimbabwe ($41,527, a difference of 0.10%). Similarly, the demographic groups most similar to Immigrants from Hungary are South African ($41,825, a difference of 0.010%), Moroccan ($41,872, a difference of 0.12%), Immigrants from Netherlands ($41,870, a difference of 0.12%), Immigrants from Scotland ($41,771, a difference of 0.12%), and Immigrants from Grenada ($41,932, a difference of 0.27%).
| Demographics | Rating | Rank | Median Female Earnings |
| Argentineans | 99.1 /100 | #92 | Exceptional $41,952 |
| Immigrants | Grenada | 99.0 /100 | #93 | Exceptional $41,932 |
| Moroccans | 98.9 /100 | #94 | Exceptional $41,872 |
| Immigrants | Netherlands | 98.9 /100 | #95 | Exceptional $41,870 |
| South Africans | 98.8 /100 | #96 | Exceptional $41,825 |
| Immigrants | Hungary | 98.8 /100 | #97 | Exceptional $41,820 |
| Immigrants | Scotland | 98.7 /100 | #98 | Exceptional $41,771 |
| Immigrants | Barbados | 98.4 /100 | #99 | Exceptional $41,685 |
| Romanians | 98.3 /100 | #100 | Exceptional $41,663 |
| Immigrants | Fiji | 98.3 /100 | #101 | Exceptional $41,656 |
| Immigrants | Poland | 98.2 /100 | #102 | Exceptional $41,630 |
| Immigrants | Argentina | 97.9 /100 | #103 | Exceptional $41,554 |
| Immigrants | Zimbabwe | 97.8 /100 | #104 | Exceptional $41,527 |
| Italians | 97.7 /100 | #105 | Exceptional $41,505 |
| Immigrants | Eritrea | 97.6 /100 | #106 | Exceptional $41,485 |
| Palestinians | 97.6 /100 | #107 | Exceptional $41,484 |
| Jordanians | 97.5 /100 | #108 | Exceptional $41,464 |
| Chinese | 97.5 /100 | #109 | Exceptional $41,461 |
| Immigrants | Western Asia | 97.0 /100 | #110 | Exceptional $41,375 |
| Immigrants | Canada | 97.0 /100 | #111 | Exceptional $41,373 |
| Immigrants | North America | 96.7 /100 | #112 | Exceptional $41,319 |