Jamaican vs Immigrants from Hungary Poverty
COMPARE
Jamaican
Immigrants from Hungary
Poverty
Poverty Comparison
Jamaicans
Immigrants from Hungary
14.4%
POVERTY
0.1/ 100
METRIC RATING
263rd/ 347
METRIC RANK
11.7%
POVERTY
88.6/ 100
METRIC RATING
123rd/ 347
METRIC RANK
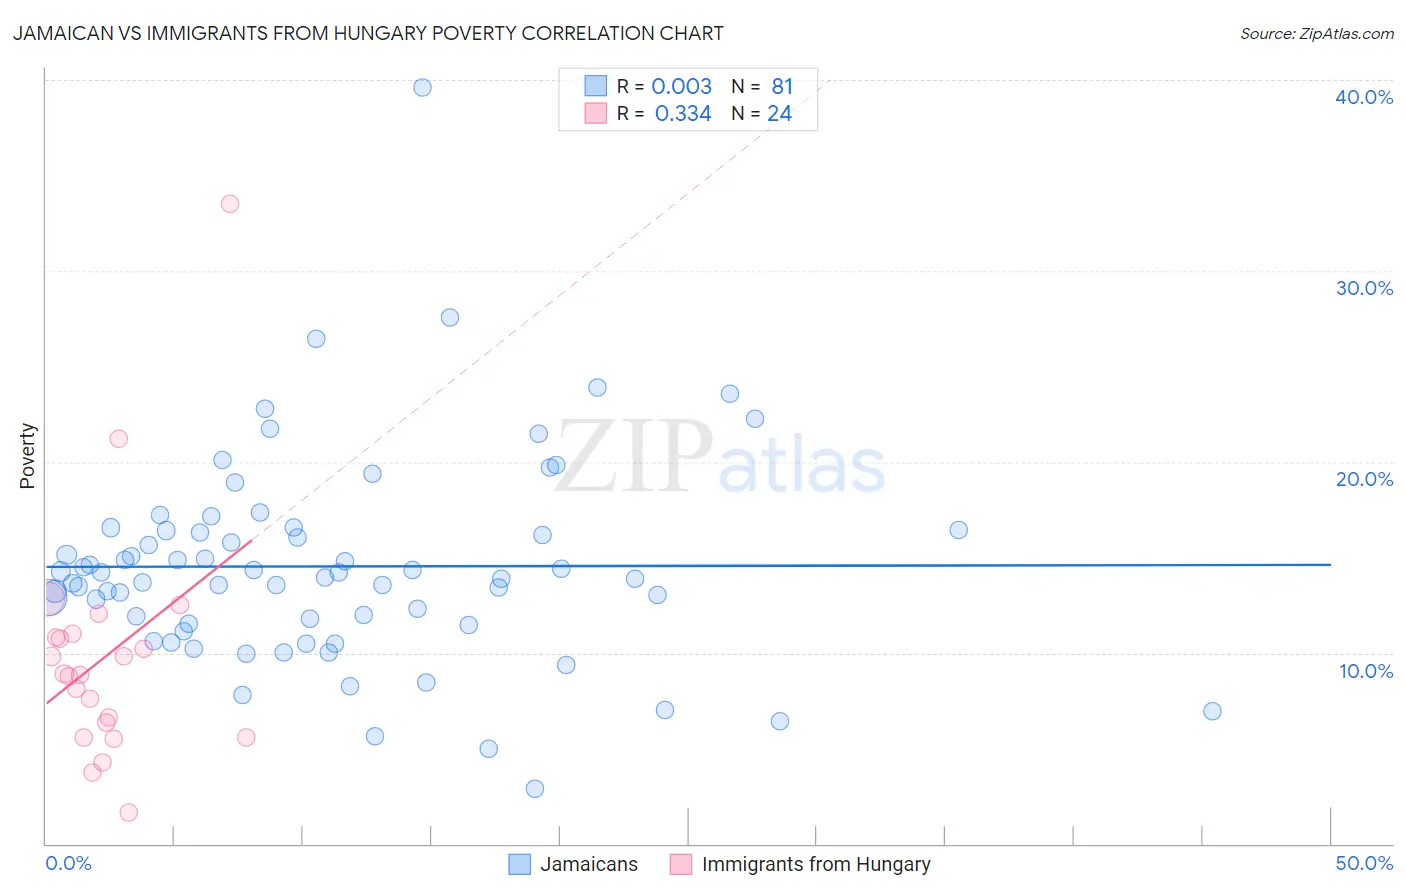
Jamaican vs Immigrants from Hungary Poverty Correlation Chart
The statistical analysis conducted on geographies consisting of 367,709,935 people shows no correlation between the proportion of Jamaicans and poverty level in the United States with a correlation coefficient (R) of 0.003 and weighted average of 14.4%. Similarly, the statistical analysis conducted on geographies consisting of 195,671,774 people shows a mild positive correlation between the proportion of Immigrants from Hungary and poverty level in the United States with a correlation coefficient (R) of 0.334 and weighted average of 11.7%, a difference of 23.3%.
Poverty Correlation Summary
| Measurement | Jamaican | Immigrants from Hungary |
| Minimum | 2.9% | 1.6% |
| Maximum | 39.6% | 33.5% |
| Range | 36.7% | 31.9% |
| Mean | 14.5% | 9.8% |
| Median | 13.9% | 8.9% |
| Interquartile 25% (IQ1) | 11.5% | 6.0% |
| Interquartile 75% (IQ3) | 16.4% | 10.9% |
| Interquartile Range (IQR) | 4.9% | 4.9% |
| Standard Deviation (Sample) | 5.4% | 6.4% |
| Standard Deviation (Population) | 5.4% | 6.3% |
Similar Demographics by Poverty
Demographics Similar to Jamaicans by Poverty
In terms of poverty, the demographic groups most similar to Jamaicans are Immigrants from Jamaica (14.4%, a difference of 0.090%), Immigrants from Guyana (14.5%, a difference of 0.21%), Immigrants from Liberia (14.4%, a difference of 0.35%), Guyanese (14.5%, a difference of 0.38%), and Cherokee (14.4%, a difference of 0.51%).
| Demographics | Rating | Rank | Poverty |
| Mexican American Indians | 0.1 /100 | #256 | Tragic 14.3% |
| Trinidadians and Tobagonians | 0.1 /100 | #257 | Tragic 14.3% |
| Ottawa | 0.1 /100 | #258 | Tragic 14.3% |
| Immigrants | Nicaragua | 0.1 /100 | #259 | Tragic 14.3% |
| Cape Verdeans | 0.1 /100 | #260 | Tragic 14.4% |
| Cherokee | 0.1 /100 | #261 | Tragic 14.4% |
| Immigrants | Liberia | 0.1 /100 | #262 | Tragic 14.4% |
| Jamaicans | 0.1 /100 | #263 | Tragic 14.4% |
| Immigrants | Jamaica | 0.1 /100 | #264 | Tragic 14.4% |
| Immigrants | Guyana | 0.1 /100 | #265 | Tragic 14.5% |
| Guyanese | 0.1 /100 | #266 | Tragic 14.5% |
| Iroquois | 0.1 /100 | #267 | Tragic 14.5% |
| Sub-Saharan Africans | 0.1 /100 | #268 | Tragic 14.5% |
| Immigrants | Cuba | 0.1 /100 | #269 | Tragic 14.6% |
| Central Americans | 0.1 /100 | #270 | Tragic 14.6% |
Demographics Similar to Immigrants from Hungary by Poverty
In terms of poverty, the demographic groups most similar to Immigrants from Hungary are New Zealander (11.7%, a difference of 0.020%), Puget Sound Salish (11.7%, a difference of 0.020%), Soviet Union (11.7%, a difference of 0.070%), Immigrants from South Eastern Asia (11.7%, a difference of 0.080%), and Tlingit-Haida (11.7%, a difference of 0.090%).
| Demographics | Rating | Rank | Poverty |
| Immigrants | Russia | 89.7 /100 | #116 | Excellent 11.7% |
| Sri Lankans | 89.4 /100 | #117 | Excellent 11.7% |
| Argentineans | 89.1 /100 | #118 | Excellent 11.7% |
| Tlingit-Haida | 89.0 /100 | #119 | Excellent 11.7% |
| Immigrants | South Eastern Asia | 88.9 /100 | #120 | Excellent 11.7% |
| New Zealanders | 88.7 /100 | #121 | Excellent 11.7% |
| Puget Sound Salish | 88.7 /100 | #122 | Excellent 11.7% |
| Immigrants | Hungary | 88.6 /100 | #123 | Excellent 11.7% |
| Soviet Union | 88.4 /100 | #124 | Excellent 11.7% |
| Immigrants | Brazil | 88.2 /100 | #125 | Excellent 11.7% |
| Immigrants | Norway | 88.0 /100 | #126 | Excellent 11.7% |
| Immigrants | Argentina | 88.0 /100 | #127 | Excellent 11.7% |
| Immigrants | Israel | 87.4 /100 | #128 | Excellent 11.7% |
| South Africans | 87.0 /100 | #129 | Excellent 11.7% |
| Immigrants | Ukraine | 86.6 /100 | #130 | Excellent 11.8% |