Marshallese vs Immigrants from Taiwan Single Father Poverty
COMPARE
Marshallese
Immigrants from Taiwan
Single Father Poverty
Single Father Poverty Comparison
Marshallese
Immigrants from Taiwan
16.9%
SINGLE FATHER POVERTY
3.1/ 100
METRIC RATING
234th/ 347
METRIC RANK
13.7%
SINGLE FATHER POVERTY
100.0/ 100
METRIC RATING
7th/ 347
METRIC RANK
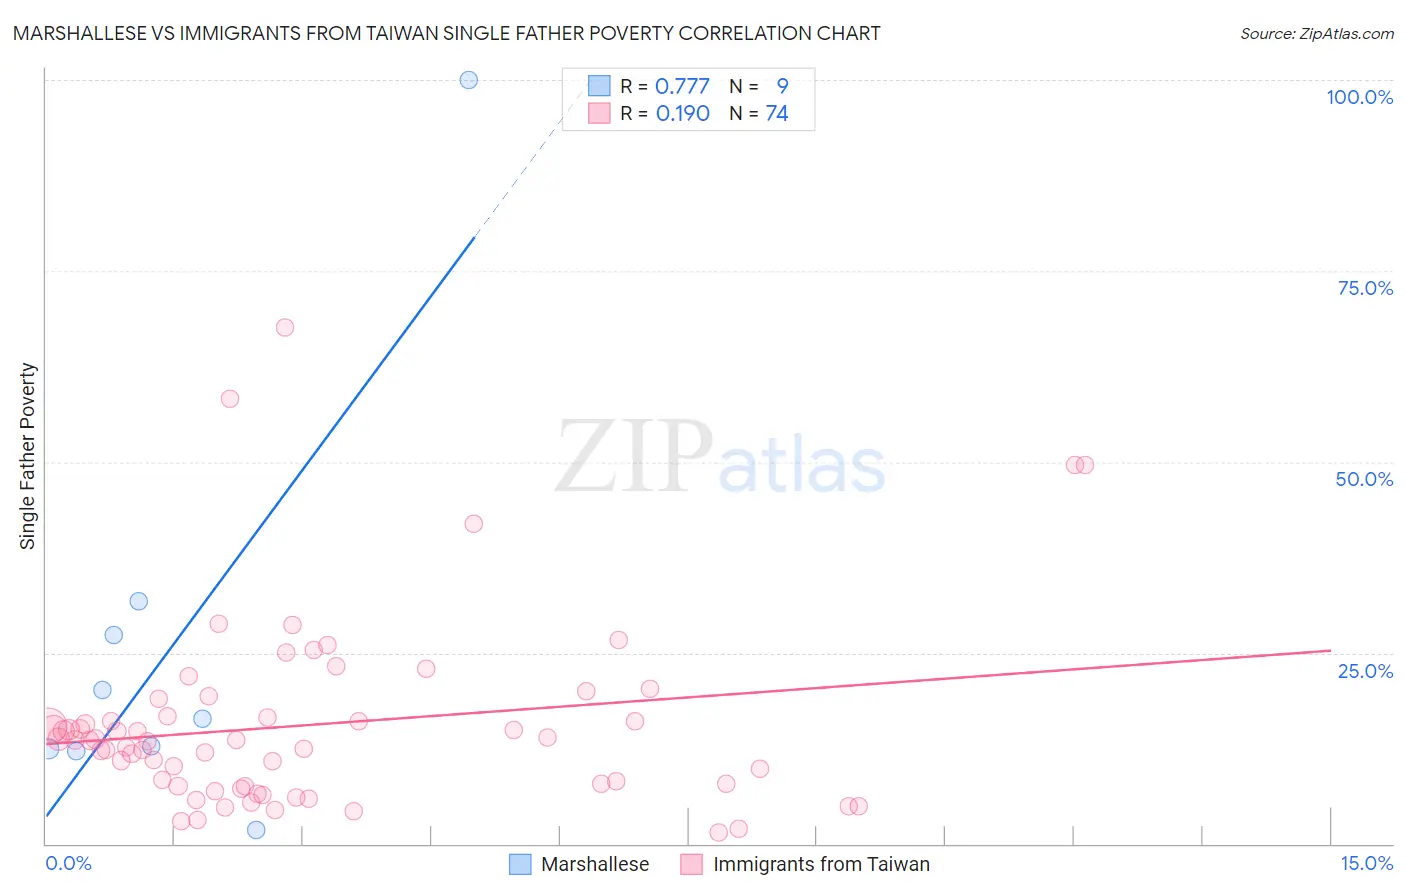
Marshallese vs Immigrants from Taiwan Single Father Poverty Correlation Chart
The statistical analysis conducted on geographies consisting of 13,927,336 people shows a strong positive correlation between the proportion of Marshallese and poverty level among single fathers in the United States with a correlation coefficient (R) of 0.777 and weighted average of 16.9%. Similarly, the statistical analysis conducted on geographies consisting of 238,751,795 people shows a poor positive correlation between the proportion of Immigrants from Taiwan and poverty level among single fathers in the United States with a correlation coefficient (R) of 0.190 and weighted average of 13.7%, a difference of 23.6%.
Single Father Poverty Correlation Summary
| Measurement | Marshallese | Immigrants from Taiwan |
| Minimum | 1.9% | 1.5% |
| Maximum | 100.0% | 67.6% |
| Range | 98.1% | 66.0% |
| Mean | 26.1% | 15.6% |
| Median | 16.3% | 13.6% |
| Interquartile 25% (IQ1) | 12.3% | 7.5% |
| Interquartile 75% (IQ3) | 29.5% | 16.8% |
| Interquartile Range (IQR) | 17.2% | 9.3% |
| Standard Deviation (Sample) | 29.1% | 12.3% |
| Standard Deviation (Population) | 27.4% | 12.2% |
Similar Demographics by Single Father Poverty
Demographics Similar to Marshallese by Single Father Poverty
In terms of single father poverty, the demographic groups most similar to Marshallese are Senegalese (16.9%, a difference of 0.030%), Immigrants from Western Europe (16.9%, a difference of 0.10%), Immigrants from Germany (16.9%, a difference of 0.10%), Subsaharan African (16.9%, a difference of 0.10%), and Immigrants from Grenada (16.9%, a difference of 0.17%).
| Demographics | Rating | Rank | Single Father Poverty |
| British | 5.6 /100 | #227 | Tragic 16.8% |
| Belgians | 5.3 /100 | #228 | Tragic 16.8% |
| Israelis | 4.6 /100 | #229 | Tragic 16.8% |
| Immigrants | Trinidad and Tobago | 4.5 /100 | #230 | Tragic 16.8% |
| Spanish Americans | 3.7 /100 | #231 | Tragic 16.9% |
| Immigrants | Grenada | 3.7 /100 | #232 | Tragic 16.9% |
| Senegalese | 3.2 /100 | #233 | Tragic 16.9% |
| Marshallese | 3.1 /100 | #234 | Tragic 16.9% |
| Immigrants | Western Europe | 2.9 /100 | #235 | Tragic 16.9% |
| Immigrants | Germany | 2.9 /100 | #236 | Tragic 16.9% |
| Sub-Saharan Africans | 2.9 /100 | #237 | Tragic 16.9% |
| Immigrants | Saudi Arabia | 2.7 /100 | #238 | Tragic 16.9% |
| Bermudans | 2.6 /100 | #239 | Tragic 16.9% |
| Finns | 2.6 /100 | #240 | Tragic 16.9% |
| Czechs | 2.3 /100 | #241 | Tragic 17.0% |
Demographics Similar to Immigrants from Taiwan by Single Father Poverty
In terms of single father poverty, the demographic groups most similar to Immigrants from Taiwan are Samoan (13.8%, a difference of 0.86%), Ethiopian (13.5%, a difference of 1.1%), Immigrants from Ethiopia (13.4%, a difference of 1.8%), Afghan (14.0%, a difference of 2.0%), and Korean (14.0%, a difference of 2.1%).
| Demographics | Rating | Rank | Single Father Poverty |
| Assyrians/Chaldeans/Syriacs | 100.0 /100 | #1 | Exceptional 11.7% |
| Tongans | 100.0 /100 | #2 | Exceptional 12.2% |
| Tsimshian | 100.0 /100 | #3 | Exceptional 12.7% |
| Immigrants | Fiji | 100.0 /100 | #4 | Exceptional 13.2% |
| Immigrants | Ethiopia | 100.0 /100 | #5 | Exceptional 13.4% |
| Ethiopians | 100.0 /100 | #6 | Exceptional 13.5% |
| Immigrants | Taiwan | 100.0 /100 | #7 | Exceptional 13.7% |
| Samoans | 100.0 /100 | #8 | Exceptional 13.8% |
| Afghans | 100.0 /100 | #9 | Exceptional 14.0% |
| Koreans | 100.0 /100 | #10 | Exceptional 14.0% |
| Filipinos | 100.0 /100 | #11 | Exceptional 14.0% |
| Immigrants | India | 100.0 /100 | #12 | Exceptional 14.0% |
| Immigrants | Philippines | 100.0 /100 | #13 | Exceptional 14.0% |
| Immigrants | Vietnam | 100.0 /100 | #14 | Exceptional 14.1% |
| Sri Lankans | 100.0 /100 | #15 | Exceptional 14.2% |