Marshallese vs Immigrants from Croatia Single Father Poverty
COMPARE
Marshallese
Immigrants from Croatia
Single Father Poverty
Single Father Poverty Comparison
Marshallese
Immigrants from Croatia
16.9%
SINGLE FATHER POVERTY
3.1/ 100
METRIC RATING
234th/ 347
METRIC RANK
16.6%
SINGLE FATHER POVERTY
16.5/ 100
METRIC RATING
202nd/ 347
METRIC RANK
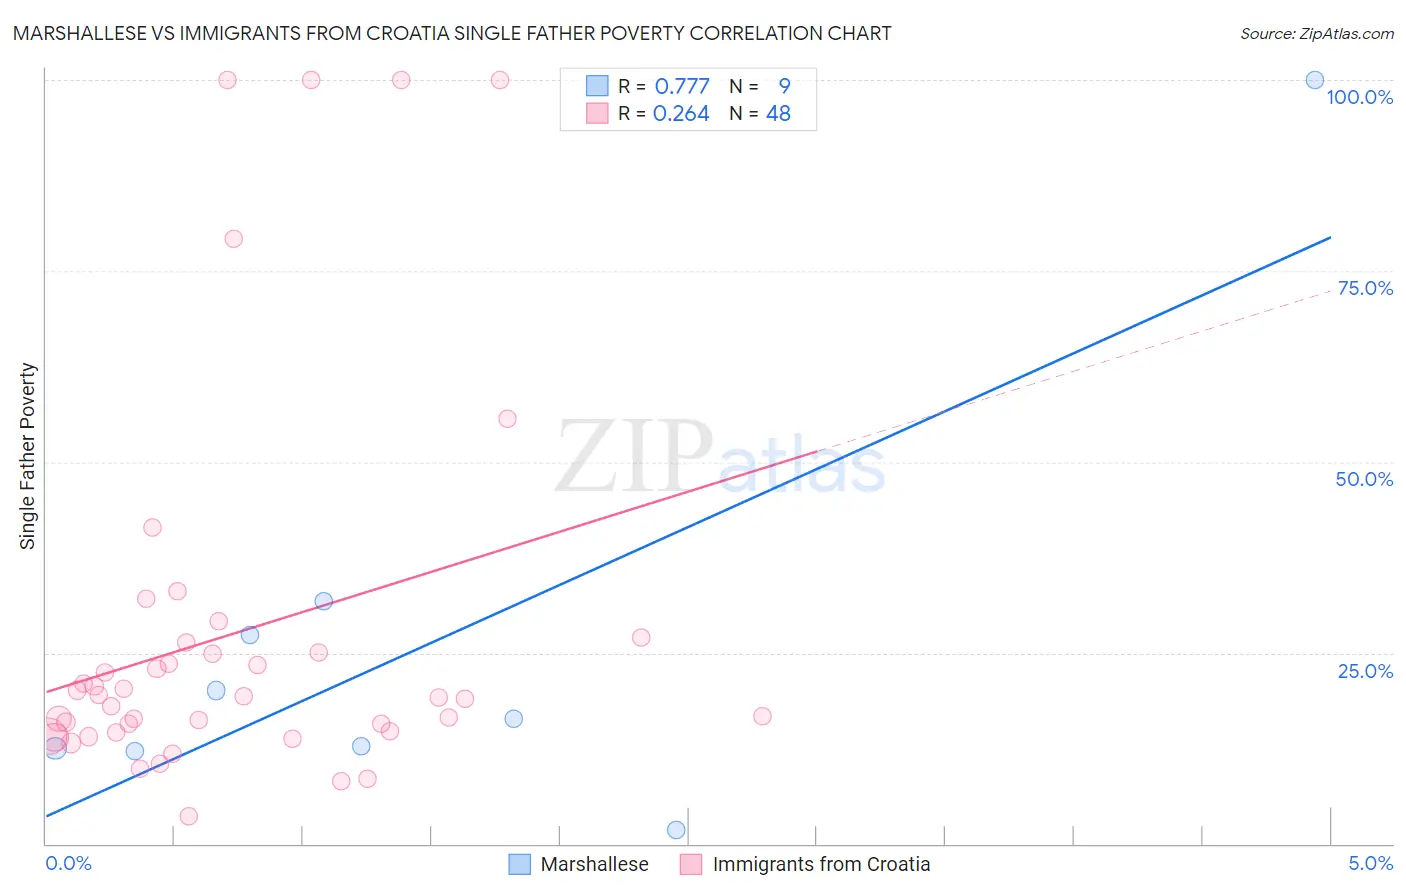
Marshallese vs Immigrants from Croatia Single Father Poverty Correlation Chart
The statistical analysis conducted on geographies consisting of 13,927,336 people shows a strong positive correlation between the proportion of Marshallese and poverty level among single fathers in the United States with a correlation coefficient (R) of 0.777 and weighted average of 16.9%. Similarly, the statistical analysis conducted on geographies consisting of 114,910,153 people shows a weak positive correlation between the proportion of Immigrants from Croatia and poverty level among single fathers in the United States with a correlation coefficient (R) of 0.264 and weighted average of 16.6%, a difference of 2.0%.
Single Father Poverty Correlation Summary
| Measurement | Marshallese | Immigrants from Croatia |
| Minimum | 1.9% | 3.6% |
| Maximum | 100.0% | 100.0% |
| Range | 98.1% | 96.4% |
| Mean | 26.1% | 27.6% |
| Median | 16.3% | 19.2% |
| Interquartile 25% (IQ1) | 12.3% | 14.7% |
| Interquartile 75% (IQ3) | 29.5% | 25.6% |
| Interquartile Range (IQR) | 17.2% | 11.0% |
| Standard Deviation (Sample) | 29.1% | 25.2% |
| Standard Deviation (Population) | 27.4% | 24.9% |
Similar Demographics by Single Father Poverty
Demographics Similar to Marshallese by Single Father Poverty
In terms of single father poverty, the demographic groups most similar to Marshallese are Senegalese (16.9%, a difference of 0.030%), Immigrants from Western Europe (16.9%, a difference of 0.10%), Immigrants from Germany (16.9%, a difference of 0.10%), Subsaharan African (16.9%, a difference of 0.10%), and Immigrants from Grenada (16.9%, a difference of 0.17%).
| Demographics | Rating | Rank | Single Father Poverty |
| British | 5.6 /100 | #227 | Tragic 16.8% |
| Belgians | 5.3 /100 | #228 | Tragic 16.8% |
| Israelis | 4.6 /100 | #229 | Tragic 16.8% |
| Immigrants | Trinidad and Tobago | 4.5 /100 | #230 | Tragic 16.8% |
| Spanish Americans | 3.7 /100 | #231 | Tragic 16.9% |
| Immigrants | Grenada | 3.7 /100 | #232 | Tragic 16.9% |
| Senegalese | 3.2 /100 | #233 | Tragic 16.9% |
| Marshallese | 3.1 /100 | #234 | Tragic 16.9% |
| Immigrants | Western Europe | 2.9 /100 | #235 | Tragic 16.9% |
| Immigrants | Germany | 2.9 /100 | #236 | Tragic 16.9% |
| Sub-Saharan Africans | 2.9 /100 | #237 | Tragic 16.9% |
| Immigrants | Saudi Arabia | 2.7 /100 | #238 | Tragic 16.9% |
| Bermudans | 2.6 /100 | #239 | Tragic 16.9% |
| Finns | 2.6 /100 | #240 | Tragic 16.9% |
| Czechs | 2.3 /100 | #241 | Tragic 17.0% |
Demographics Similar to Immigrants from Croatia by Single Father Poverty
In terms of single father poverty, the demographic groups most similar to Immigrants from Croatia are Cuban (16.6%, a difference of 0.0%), Syrian (16.6%, a difference of 0.070%), Immigrants from North America (16.6%, a difference of 0.11%), Immigrants from Guatemala (16.6%, a difference of 0.14%), and Venezuelan (16.6%, a difference of 0.19%).
| Demographics | Rating | Rank | Single Father Poverty |
| Immigrants | Barbados | 24.3 /100 | #195 | Fair 16.5% |
| Immigrants | Canada | 21.9 /100 | #196 | Fair 16.5% |
| Immigrants | Northern Europe | 20.3 /100 | #197 | Fair 16.5% |
| Romanians | 20.1 /100 | #198 | Fair 16.5% |
| Immigrants | Belize | 19.8 /100 | #199 | Poor 16.5% |
| Syrians | 17.4 /100 | #200 | Poor 16.6% |
| Cubans | 16.5 /100 | #201 | Poor 16.6% |
| Immigrants | Croatia | 16.5 /100 | #202 | Poor 16.6% |
| Immigrants | North America | 15.1 /100 | #203 | Poor 16.6% |
| Immigrants | Guatemala | 14.8 /100 | #204 | Poor 16.6% |
| Venezuelans | 14.3 /100 | #205 | Poor 16.6% |
| Immigrants | Senegal | 13.7 /100 | #206 | Poor 16.6% |
| New Zealanders | 13.7 /100 | #207 | Poor 16.6% |
| Eastern Europeans | 13.7 /100 | #208 | Poor 16.6% |
| Europeans | 13.2 /100 | #209 | Poor 16.6% |