Marshallese vs Immigrants from Switzerland Single Father Poverty
COMPARE
Marshallese
Immigrants from Switzerland
Single Father Poverty
Single Father Poverty Comparison
Marshallese
Immigrants from Switzerland
16.9%
SINGLE FATHER POVERTY
3.1/ 100
METRIC RATING
234th/ 347
METRIC RANK
16.5%
SINGLE FATHER POVERTY
24.8/ 100
METRIC RATING
192nd/ 347
METRIC RANK
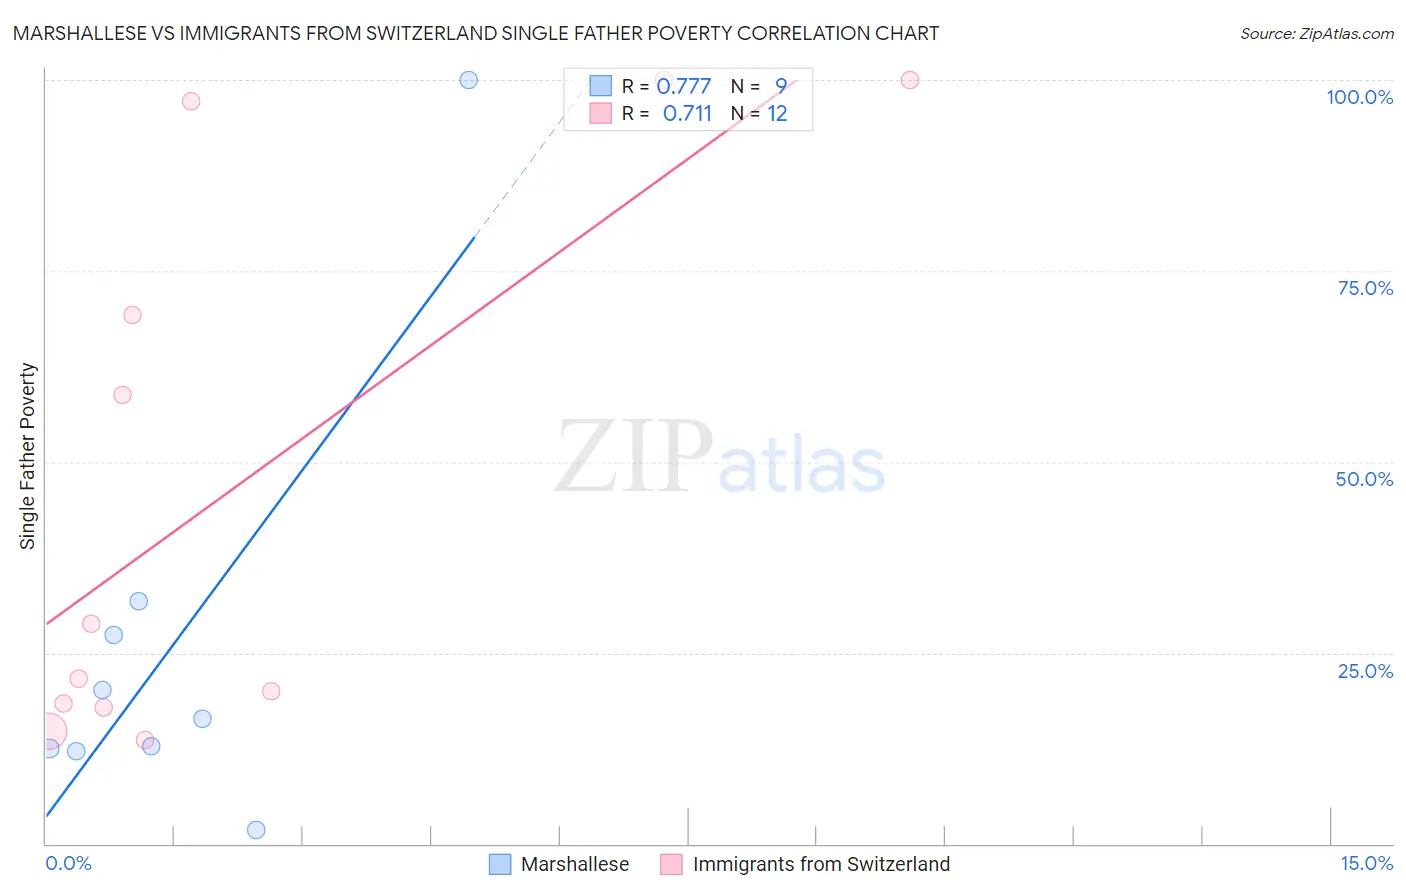
Marshallese vs Immigrants from Switzerland Single Father Poverty Correlation Chart
The statistical analysis conducted on geographies consisting of 13,927,336 people shows a strong positive correlation between the proportion of Marshallese and poverty level among single fathers in the United States with a correlation coefficient (R) of 0.777 and weighted average of 16.9%. Similarly, the statistical analysis conducted on geographies consisting of 124,581,780 people shows a strong positive correlation between the proportion of Immigrants from Switzerland and poverty level among single fathers in the United States with a correlation coefficient (R) of 0.711 and weighted average of 16.5%, a difference of 2.5%.
Single Father Poverty Correlation Summary
| Measurement | Marshallese | Immigrants from Switzerland |
| Minimum | 1.9% | 13.7% |
| Maximum | 100.0% | 100.0% |
| Range | 98.1% | 86.3% |
| Mean | 26.1% | 46.7% |
| Median | 16.3% | 25.2% |
| Interquartile 25% (IQ1) | 12.3% | 18.1% |
| Interquartile 75% (IQ3) | 29.5% | 83.2% |
| Interquartile Range (IQR) | 17.2% | 65.1% |
| Standard Deviation (Sample) | 29.1% | 36.1% |
| Standard Deviation (Population) | 27.4% | 34.5% |
Similar Demographics by Single Father Poverty
Demographics Similar to Marshallese by Single Father Poverty
In terms of single father poverty, the demographic groups most similar to Marshallese are Senegalese (16.9%, a difference of 0.030%), Immigrants from Western Europe (16.9%, a difference of 0.10%), Immigrants from Germany (16.9%, a difference of 0.10%), Subsaharan African (16.9%, a difference of 0.10%), and Immigrants from Grenada (16.9%, a difference of 0.17%).
| Demographics | Rating | Rank | Single Father Poverty |
| British | 5.6 /100 | #227 | Tragic 16.8% |
| Belgians | 5.3 /100 | #228 | Tragic 16.8% |
| Israelis | 4.6 /100 | #229 | Tragic 16.8% |
| Immigrants | Trinidad and Tobago | 4.5 /100 | #230 | Tragic 16.8% |
| Spanish Americans | 3.7 /100 | #231 | Tragic 16.9% |
| Immigrants | Grenada | 3.7 /100 | #232 | Tragic 16.9% |
| Senegalese | 3.2 /100 | #233 | Tragic 16.9% |
| Marshallese | 3.1 /100 | #234 | Tragic 16.9% |
| Immigrants | Western Europe | 2.9 /100 | #235 | Tragic 16.9% |
| Immigrants | Germany | 2.9 /100 | #236 | Tragic 16.9% |
| Sub-Saharan Africans | 2.9 /100 | #237 | Tragic 16.9% |
| Immigrants | Saudi Arabia | 2.7 /100 | #238 | Tragic 16.9% |
| Bermudans | 2.6 /100 | #239 | Tragic 16.9% |
| Finns | 2.6 /100 | #240 | Tragic 16.9% |
| Czechs | 2.3 /100 | #241 | Tragic 17.0% |
Demographics Similar to Immigrants from Switzerland by Single Father Poverty
In terms of single father poverty, the demographic groups most similar to Immigrants from Switzerland are Ecuadorian (16.5%, a difference of 0.010%), Cape Verdean (16.5%, a difference of 0.020%), Immigrants from Barbados (16.5%, a difference of 0.030%), Immigrants from Guyana (16.5%, a difference of 0.13%), and Immigrants from Canada (16.5%, a difference of 0.17%).
| Demographics | Rating | Rank | Single Father Poverty |
| Panamanians | 33.6 /100 | #185 | Fair 16.4% |
| Immigrants | Venezuela | 31.0 /100 | #186 | Fair 16.4% |
| Ukrainians | 30.4 /100 | #187 | Fair 16.4% |
| Russians | 30.1 /100 | #188 | Fair 16.4% |
| Latvians | 28.9 /100 | #189 | Fair 16.5% |
| Immigrants | Burma/Myanmar | 28.0 /100 | #190 | Fair 16.5% |
| Immigrants | Guyana | 27.1 /100 | #191 | Fair 16.5% |
| Immigrants | Switzerland | 24.8 /100 | #192 | Fair 16.5% |
| Ecuadorians | 24.5 /100 | #193 | Fair 16.5% |
| Cape Verdeans | 24.4 /100 | #194 | Fair 16.5% |
| Immigrants | Barbados | 24.3 /100 | #195 | Fair 16.5% |
| Immigrants | Canada | 21.9 /100 | #196 | Fair 16.5% |
| Immigrants | Northern Europe | 20.3 /100 | #197 | Fair 16.5% |
| Romanians | 20.1 /100 | #198 | Fair 16.5% |
| Immigrants | Belize | 19.8 /100 | #199 | Poor 16.5% |