Choctaw vs Immigrants from Taiwan Single Father Poverty
COMPARE
Choctaw
Immigrants from Taiwan
Single Father Poverty
Single Father Poverty Comparison
Choctaw
Immigrants from Taiwan
20.7%
SINGLE FATHER POVERTY
0.0/ 100
METRIC RATING
327th/ 347
METRIC RANK
13.7%
SINGLE FATHER POVERTY
100.0/ 100
METRIC RATING
7th/ 347
METRIC RANK
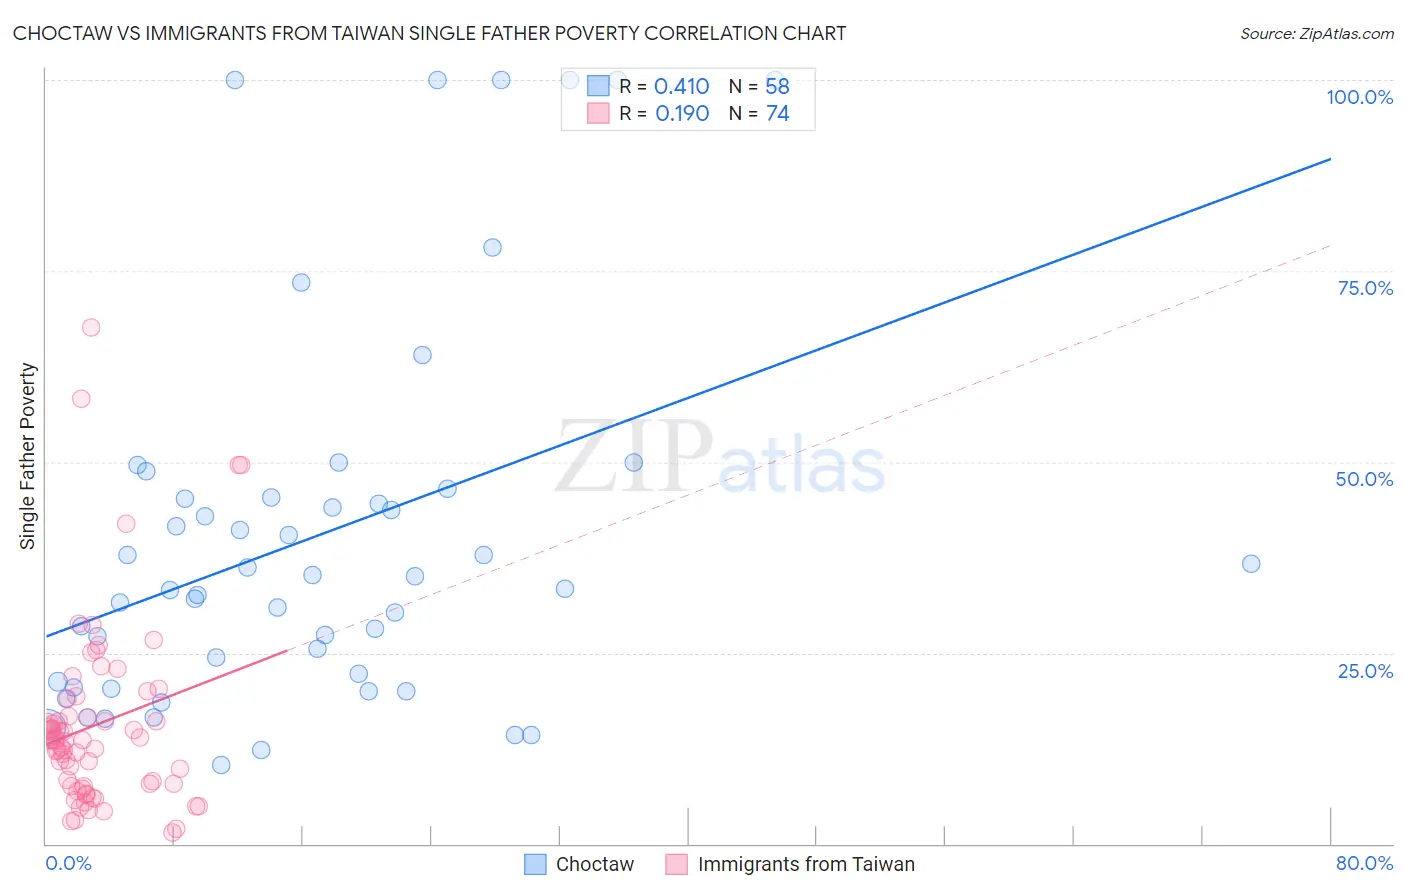
Choctaw vs Immigrants from Taiwan Single Father Poverty Correlation Chart
The statistical analysis conducted on geographies consisting of 228,054,527 people shows a moderate positive correlation between the proportion of Choctaw and poverty level among single fathers in the United States with a correlation coefficient (R) of 0.410 and weighted average of 20.7%. Similarly, the statistical analysis conducted on geographies consisting of 238,751,795 people shows a poor positive correlation between the proportion of Immigrants from Taiwan and poverty level among single fathers in the United States with a correlation coefficient (R) of 0.190 and weighted average of 13.7%, a difference of 51.4%.
Single Father Poverty Correlation Summary
| Measurement | Choctaw | Immigrants from Taiwan |
| Minimum | 10.3% | 1.5% |
| Maximum | 100.0% | 67.6% |
| Range | 89.7% | 66.0% |
| Mean | 40.2% | 15.6% |
| Median | 34.2% | 13.6% |
| Interquartile 25% (IQ1) | 21.2% | 7.5% |
| Interquartile 75% (IQ3) | 45.3% | 16.8% |
| Interquartile Range (IQR) | 24.1% | 9.3% |
| Standard Deviation (Sample) | 24.9% | 12.3% |
| Standard Deviation (Population) | 24.7% | 12.2% |
Similar Demographics by Single Father Poverty
Demographics Similar to Choctaw by Single Father Poverty
In terms of single father poverty, the demographic groups most similar to Choctaw are Immigrants from Yemen (20.6%, a difference of 0.69%), Black/African American (20.4%, a difference of 1.7%), Pueblo (21.1%, a difference of 1.9%), Colville (21.4%, a difference of 3.0%), and American (20.1%, a difference of 3.3%).
| Demographics | Rating | Rank | Single Father Poverty |
| Inupiat | 0.0 /100 | #320 | Tragic 19.5% |
| Cherokee | 0.0 /100 | #321 | Tragic 19.6% |
| Creek | 0.0 /100 | #322 | Tragic 19.8% |
| Pennsylvania Germans | 0.0 /100 | #323 | Tragic 20.0% |
| Americans | 0.0 /100 | #324 | Tragic 20.1% |
| Blacks/African Americans | 0.0 /100 | #325 | Tragic 20.4% |
| Immigrants | Yemen | 0.0 /100 | #326 | Tragic 20.6% |
| Choctaw | 0.0 /100 | #327 | Tragic 20.7% |
| Pueblo | 0.0 /100 | #328 | Tragic 21.1% |
| Colville | 0.0 /100 | #329 | Tragic 21.4% |
| Paiute | 0.0 /100 | #330 | Tragic 21.6% |
| Central American Indians | 0.0 /100 | #331 | Tragic 21.7% |
| Tohono O'odham | 0.0 /100 | #332 | Tragic 22.0% |
| Natives/Alaskans | 0.0 /100 | #333 | Tragic 22.4% |
| Kiowa | 0.0 /100 | #334 | Tragic 22.5% |
Demographics Similar to Immigrants from Taiwan by Single Father Poverty
In terms of single father poverty, the demographic groups most similar to Immigrants from Taiwan are Samoan (13.8%, a difference of 0.86%), Ethiopian (13.5%, a difference of 1.1%), Immigrants from Ethiopia (13.4%, a difference of 1.8%), Afghan (14.0%, a difference of 2.0%), and Korean (14.0%, a difference of 2.1%).
| Demographics | Rating | Rank | Single Father Poverty |
| Assyrians/Chaldeans/Syriacs | 100.0 /100 | #1 | Exceptional 11.7% |
| Tongans | 100.0 /100 | #2 | Exceptional 12.2% |
| Tsimshian | 100.0 /100 | #3 | Exceptional 12.7% |
| Immigrants | Fiji | 100.0 /100 | #4 | Exceptional 13.2% |
| Immigrants | Ethiopia | 100.0 /100 | #5 | Exceptional 13.4% |
| Ethiopians | 100.0 /100 | #6 | Exceptional 13.5% |
| Immigrants | Taiwan | 100.0 /100 | #7 | Exceptional 13.7% |
| Samoans | 100.0 /100 | #8 | Exceptional 13.8% |
| Afghans | 100.0 /100 | #9 | Exceptional 14.0% |
| Koreans | 100.0 /100 | #10 | Exceptional 14.0% |
| Filipinos | 100.0 /100 | #11 | Exceptional 14.0% |
| Immigrants | India | 100.0 /100 | #12 | Exceptional 14.0% |
| Immigrants | Philippines | 100.0 /100 | #13 | Exceptional 14.0% |
| Immigrants | Vietnam | 100.0 /100 | #14 | Exceptional 14.1% |
| Sri Lankans | 100.0 /100 | #15 | Exceptional 14.2% |