Marshallese vs Immigrants from Dominican Republic Single Father Poverty
COMPARE
Marshallese
Immigrants from Dominican Republic
Single Father Poverty
Single Father Poverty Comparison
Marshallese
Immigrants from Dominican Republic
16.9%
SINGLE FATHER POVERTY
3.1/ 100
METRIC RATING
234th/ 347
METRIC RANK
18.4%
SINGLE FATHER POVERTY
0.0/ 100
METRIC RATING
300th/ 347
METRIC RANK
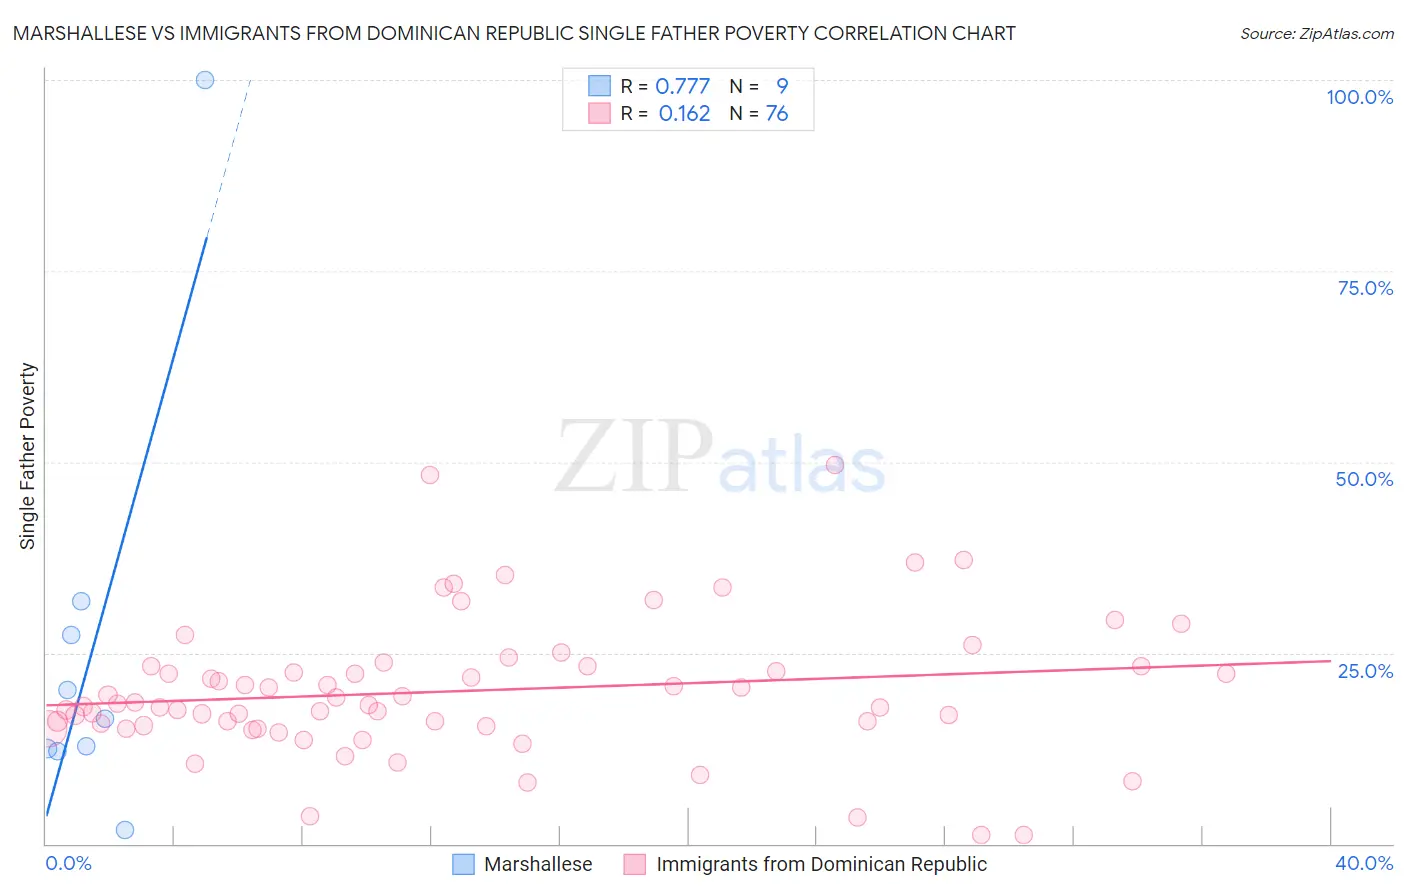
Marshallese vs Immigrants from Dominican Republic Single Father Poverty Correlation Chart
The statistical analysis conducted on geographies consisting of 13,927,336 people shows a strong positive correlation between the proportion of Marshallese and poverty level among single fathers in the United States with a correlation coefficient (R) of 0.777 and weighted average of 16.9%. Similarly, the statistical analysis conducted on geographies consisting of 226,907,636 people shows a poor positive correlation between the proportion of Immigrants from Dominican Republic and poverty level among single fathers in the United States with a correlation coefficient (R) of 0.162 and weighted average of 18.4%, a difference of 8.9%.
Single Father Poverty Correlation Summary
| Measurement | Marshallese | Immigrants from Dominican Republic |
| Minimum | 1.9% | 1.2% |
| Maximum | 100.0% | 49.7% |
| Range | 98.1% | 48.4% |
| Mean | 26.1% | 20.0% |
| Median | 16.3% | 18.2% |
| Interquartile 25% (IQ1) | 12.3% | 15.4% |
| Interquartile 75% (IQ3) | 29.5% | 23.2% |
| Interquartile Range (IQR) | 17.2% | 7.8% |
| Standard Deviation (Sample) | 29.1% | 9.0% |
| Standard Deviation (Population) | 27.4% | 9.0% |
Similar Demographics by Single Father Poverty
Demographics Similar to Marshallese by Single Father Poverty
In terms of single father poverty, the demographic groups most similar to Marshallese are Senegalese (16.9%, a difference of 0.030%), Immigrants from Western Europe (16.9%, a difference of 0.10%), Immigrants from Germany (16.9%, a difference of 0.10%), Subsaharan African (16.9%, a difference of 0.10%), and Immigrants from Grenada (16.9%, a difference of 0.17%).
| Demographics | Rating | Rank | Single Father Poverty |
| British | 5.6 /100 | #227 | Tragic 16.8% |
| Belgians | 5.3 /100 | #228 | Tragic 16.8% |
| Israelis | 4.6 /100 | #229 | Tragic 16.8% |
| Immigrants | Trinidad and Tobago | 4.5 /100 | #230 | Tragic 16.8% |
| Spanish Americans | 3.7 /100 | #231 | Tragic 16.9% |
| Immigrants | Grenada | 3.7 /100 | #232 | Tragic 16.9% |
| Senegalese | 3.2 /100 | #233 | Tragic 16.9% |
| Marshallese | 3.1 /100 | #234 | Tragic 16.9% |
| Immigrants | Western Europe | 2.9 /100 | #235 | Tragic 16.9% |
| Immigrants | Germany | 2.9 /100 | #236 | Tragic 16.9% |
| Sub-Saharan Africans | 2.9 /100 | #237 | Tragic 16.9% |
| Immigrants | Saudi Arabia | 2.7 /100 | #238 | Tragic 16.9% |
| Bermudans | 2.6 /100 | #239 | Tragic 16.9% |
| Finns | 2.6 /100 | #240 | Tragic 16.9% |
| Czechs | 2.3 /100 | #241 | Tragic 17.0% |
Demographics Similar to Immigrants from Dominican Republic by Single Father Poverty
In terms of single father poverty, the demographic groups most similar to Immigrants from Dominican Republic are Hungarian (18.5%, a difference of 0.22%), White/Caucasian (18.4%, a difference of 0.32%), Comanche (18.5%, a difference of 0.32%), Celtic (18.5%, a difference of 0.37%), and Ute (18.5%, a difference of 0.51%).
| Demographics | Rating | Rank | Single Father Poverty |
| Alaska Natives | 0.0 /100 | #293 | Tragic 18.1% |
| U.S. Virgin Islanders | 0.0 /100 | #294 | Tragic 18.1% |
| Yakama | 0.0 /100 | #295 | Tragic 18.1% |
| Seminole | 0.0 /100 | #296 | Tragic 18.1% |
| French | 0.0 /100 | #297 | Tragic 18.2% |
| Africans | 0.0 /100 | #298 | Tragic 18.3% |
| Whites/Caucasians | 0.0 /100 | #299 | Tragic 18.4% |
| Immigrants | Dominican Republic | 0.0 /100 | #300 | Tragic 18.4% |
| Hungarians | 0.0 /100 | #301 | Tragic 18.5% |
| Comanche | 0.0 /100 | #302 | Tragic 18.5% |
| Celtics | 0.0 /100 | #303 | Tragic 18.5% |
| Ute | 0.0 /100 | #304 | Tragic 18.5% |
| Blackfeet | 0.0 /100 | #305 | Tragic 18.5% |
| Scotch-Irish | 0.0 /100 | #306 | Tragic 18.6% |
| French Canadians | 0.0 /100 | #307 | Tragic 18.6% |