Spanish American Indian vs Immigrants from Taiwan Single Father Poverty
COMPARE
Spanish American Indian
Immigrants from Taiwan
Single Father Poverty
Single Father Poverty Comparison
Spanish American Indians
Immigrants from Taiwan
14.4%
SINGLE FATHER POVERTY
100.0/ 100
METRIC RATING
26th/ 347
METRIC RANK
13.7%
SINGLE FATHER POVERTY
100.0/ 100
METRIC RATING
7th/ 347
METRIC RANK
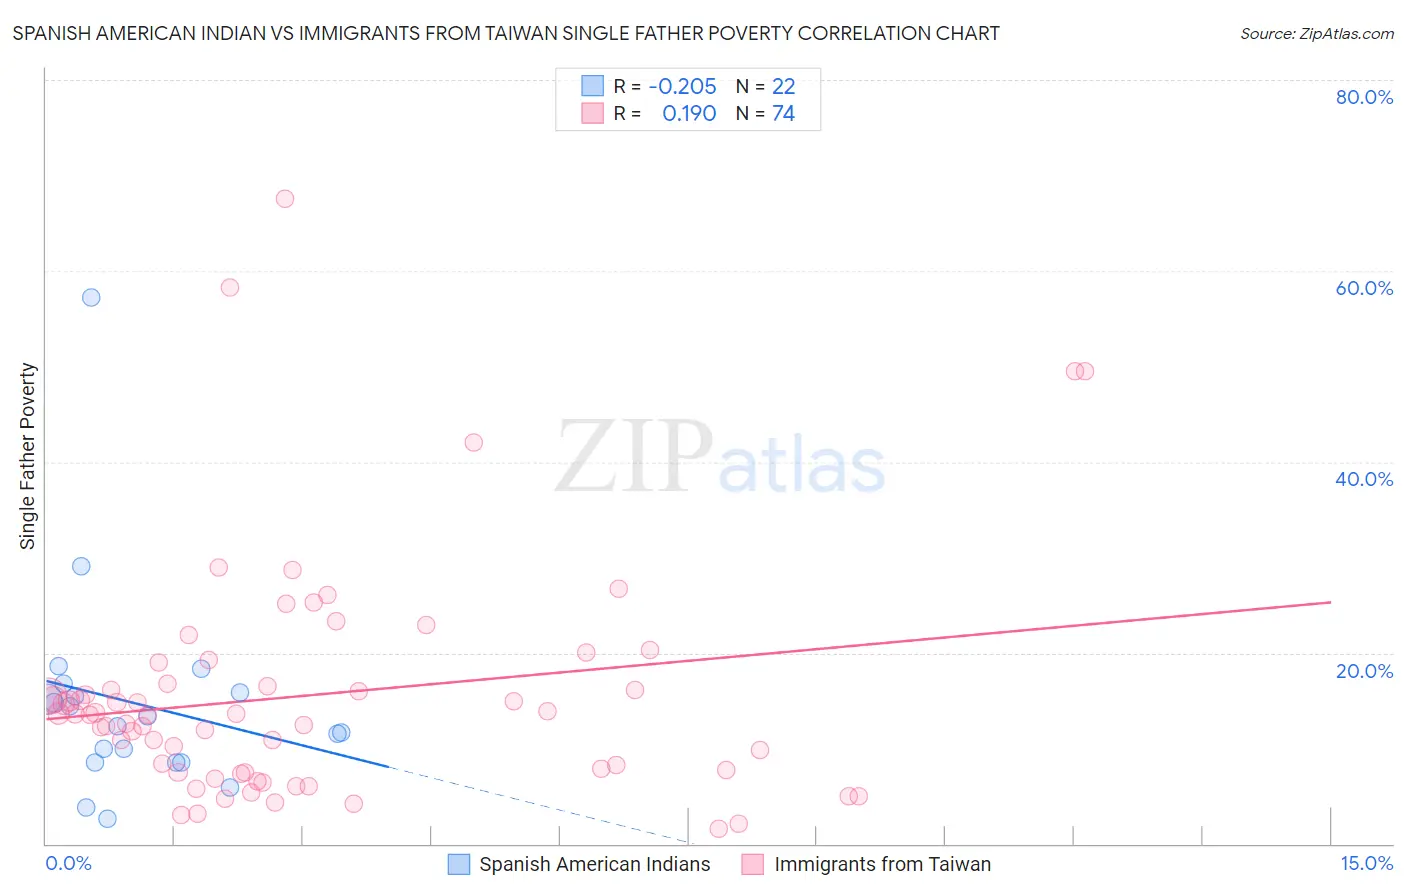
Spanish American Indian vs Immigrants from Taiwan Single Father Poverty Correlation Chart
The statistical analysis conducted on geographies consisting of 69,773,093 people shows a weak negative correlation between the proportion of Spanish American Indians and poverty level among single fathers in the United States with a correlation coefficient (R) of -0.205 and weighted average of 14.4%. Similarly, the statistical analysis conducted on geographies consisting of 238,751,795 people shows a poor positive correlation between the proportion of Immigrants from Taiwan and poverty level among single fathers in the United States with a correlation coefficient (R) of 0.190 and weighted average of 13.7%, a difference of 5.3%.
Single Father Poverty Correlation Summary
| Measurement | Spanish American Indian | Immigrants from Taiwan |
| Minimum | 2.6% | 1.5% |
| Maximum | 57.2% | 67.6% |
| Range | 54.6% | 66.0% |
| Mean | 14.6% | 15.6% |
| Median | 12.9% | 13.6% |
| Interquartile 25% (IQ1) | 8.5% | 7.5% |
| Interquartile 75% (IQ3) | 15.8% | 16.8% |
| Interquartile Range (IQR) | 7.3% | 9.3% |
| Standard Deviation (Sample) | 11.1% | 12.3% |
| Standard Deviation (Population) | 10.8% | 12.2% |
Demographics Similar to Spanish American Indians and Immigrants from Taiwan by Single Father Poverty
In terms of single father poverty, the demographic groups most similar to Spanish American Indians are Iranian (14.4%, a difference of 0.42%), Immigrants from Egypt (14.4%, a difference of 0.46%), Immigrants from South Eastern Asia (14.4%, a difference of 0.46%), Taiwanese (14.3%, a difference of 0.67%), and Immigrants from Afghanistan (14.3%, a difference of 1.0%). Similarly, the demographic groups most similar to Immigrants from Taiwan are Samoan (13.8%, a difference of 0.86%), Ethiopian (13.5%, a difference of 1.1%), Afghan (14.0%, a difference of 2.0%), Korean (14.0%, a difference of 2.1%), and Filipino (14.0%, a difference of 2.5%).
| Demographics | Rating | Rank | Single Father Poverty |
| Ethiopians | 100.0 /100 | #6 | Exceptional 13.5% |
| Immigrants | Taiwan | 100.0 /100 | #7 | Exceptional 13.7% |
| Samoans | 100.0 /100 | #8 | Exceptional 13.8% |
| Afghans | 100.0 /100 | #9 | Exceptional 14.0% |
| Koreans | 100.0 /100 | #10 | Exceptional 14.0% |
| Filipinos | 100.0 /100 | #11 | Exceptional 14.0% |
| Immigrants | India | 100.0 /100 | #12 | Exceptional 14.0% |
| Immigrants | Philippines | 100.0 /100 | #13 | Exceptional 14.0% |
| Immigrants | Vietnam | 100.0 /100 | #14 | Exceptional 14.1% |
| Sri Lankans | 100.0 /100 | #15 | Exceptional 14.2% |
| Immigrants | Iran | 100.0 /100 | #16 | Exceptional 14.2% |
| Immigrants | Hong Kong | 100.0 /100 | #17 | Exceptional 14.2% |
| Soviet Union | 100.0 /100 | #18 | Exceptional 14.3% |
| Immigrants | Iraq | 100.0 /100 | #19 | Exceptional 14.3% |
| Immigrants | Singapore | 100.0 /100 | #20 | Exceptional 14.3% |
| Immigrants | Afghanistan | 100.0 /100 | #21 | Exceptional 14.3% |
| Taiwanese | 100.0 /100 | #22 | Exceptional 14.3% |
| Immigrants | Egypt | 100.0 /100 | #23 | Exceptional 14.4% |
| Immigrants | South Eastern Asia | 100.0 /100 | #24 | Exceptional 14.4% |
| Iranians | 100.0 /100 | #25 | Exceptional 14.4% |
| Spanish American Indians | 100.0 /100 | #26 | Exceptional 14.4% |