Marshallese vs Spaniard Single Father Poverty
COMPARE
Marshallese
Spaniard
Single Father Poverty
Single Father Poverty Comparison
Marshallese
Spaniards
16.9%
SINGLE FATHER POVERTY
3.1/ 100
METRIC RATING
234th/ 347
METRIC RANK
17.2%
SINGLE FATHER POVERTY
0.6/ 100
METRIC RATING
260th/ 347
METRIC RANK
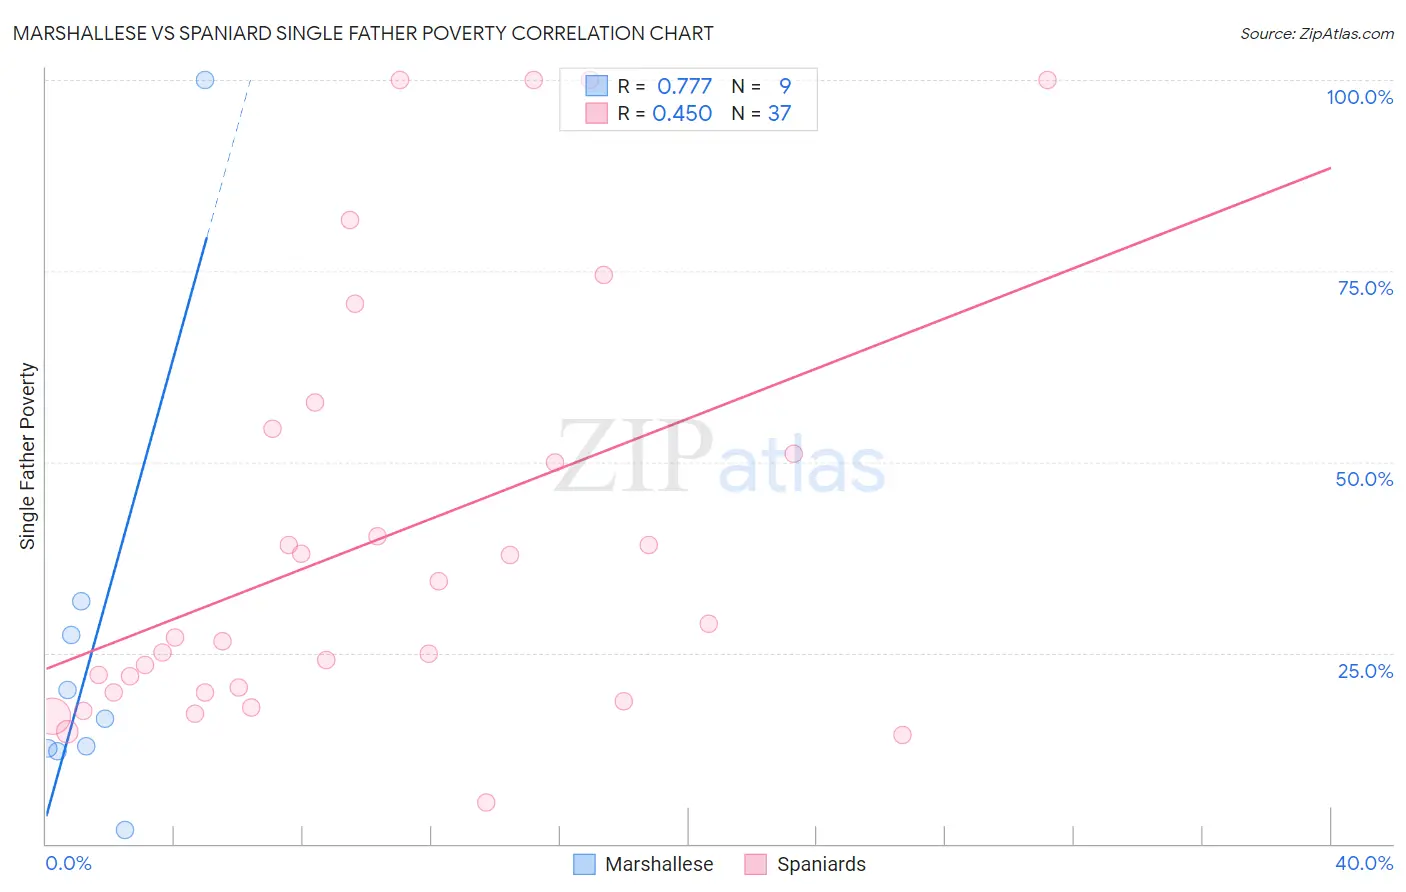
Marshallese vs Spaniard Single Father Poverty Correlation Chart
The statistical analysis conducted on geographies consisting of 13,927,336 people shows a strong positive correlation between the proportion of Marshallese and poverty level among single fathers in the United States with a correlation coefficient (R) of 0.777 and weighted average of 16.9%. Similarly, the statistical analysis conducted on geographies consisting of 345,009,065 people shows a moderate positive correlation between the proportion of Spaniards and poverty level among single fathers in the United States with a correlation coefficient (R) of 0.450 and weighted average of 17.2%, a difference of 1.8%.
Single Father Poverty Correlation Summary
| Measurement | Marshallese | Spaniard |
| Minimum | 1.9% | 5.4% |
| Maximum | 100.0% | 100.0% |
| Range | 98.1% | 94.6% |
| Mean | 26.1% | 39.8% |
| Median | 16.3% | 27.0% |
| Interquartile 25% (IQ1) | 12.3% | 19.8% |
| Interquartile 75% (IQ3) | 29.5% | 52.7% |
| Interquartile Range (IQR) | 17.2% | 32.9% |
| Standard Deviation (Sample) | 29.1% | 27.6% |
| Standard Deviation (Population) | 27.4% | 27.2% |
Similar Demographics by Single Father Poverty
Demographics Similar to Marshallese by Single Father Poverty
In terms of single father poverty, the demographic groups most similar to Marshallese are Senegalese (16.9%, a difference of 0.030%), Immigrants from Western Europe (16.9%, a difference of 0.10%), Immigrants from Germany (16.9%, a difference of 0.10%), Subsaharan African (16.9%, a difference of 0.10%), and Immigrants from Grenada (16.9%, a difference of 0.17%).
| Demographics | Rating | Rank | Single Father Poverty |
| British | 5.6 /100 | #227 | Tragic 16.8% |
| Belgians | 5.3 /100 | #228 | Tragic 16.8% |
| Israelis | 4.6 /100 | #229 | Tragic 16.8% |
| Immigrants | Trinidad and Tobago | 4.5 /100 | #230 | Tragic 16.8% |
| Spanish Americans | 3.7 /100 | #231 | Tragic 16.9% |
| Immigrants | Grenada | 3.7 /100 | #232 | Tragic 16.9% |
| Senegalese | 3.2 /100 | #233 | Tragic 16.9% |
| Marshallese | 3.1 /100 | #234 | Tragic 16.9% |
| Immigrants | Western Europe | 2.9 /100 | #235 | Tragic 16.9% |
| Immigrants | Germany | 2.9 /100 | #236 | Tragic 16.9% |
| Sub-Saharan Africans | 2.9 /100 | #237 | Tragic 16.9% |
| Immigrants | Saudi Arabia | 2.7 /100 | #238 | Tragic 16.9% |
| Bermudans | 2.6 /100 | #239 | Tragic 16.9% |
| Finns | 2.6 /100 | #240 | Tragic 16.9% |
| Czechs | 2.3 /100 | #241 | Tragic 17.0% |
Demographics Similar to Spaniards by Single Father Poverty
In terms of single father poverty, the demographic groups most similar to Spaniards are Immigrants from Jamaica (17.2%, a difference of 0.15%), Albanian (17.2%, a difference of 0.18%), Immigrants from Albania (17.2%, a difference of 0.20%), Swiss (17.3%, a difference of 0.22%), and Immigrants from Haiti (17.2%, a difference of 0.28%).
| Demographics | Rating | Rank | Single Father Poverty |
| Cree | 1.0 /100 | #253 | Tragic 17.1% |
| Immigrants | Honduras | 0.9 /100 | #254 | Tragic 17.1% |
| Sierra Leoneans | 0.8 /100 | #255 | Tragic 17.2% |
| Immigrants | Haiti | 0.8 /100 | #256 | Tragic 17.2% |
| Immigrants | Albania | 0.7 /100 | #257 | Tragic 17.2% |
| Albanians | 0.7 /100 | #258 | Tragic 17.2% |
| Immigrants | Jamaica | 0.7 /100 | #259 | Tragic 17.2% |
| Spaniards | 0.6 /100 | #260 | Tragic 17.2% |
| Swiss | 0.5 /100 | #261 | Tragic 17.3% |
| Immigrants | Zaire | 0.4 /100 | #262 | Tragic 17.3% |
| Lithuanians | 0.4 /100 | #263 | Tragic 17.3% |
| Slovenes | 0.3 /100 | #264 | Tragic 17.3% |
| Poles | 0.3 /100 | #265 | Tragic 17.3% |
| Jamaicans | 0.3 /100 | #266 | Tragic 17.3% |
| Haitians | 0.3 /100 | #267 | Tragic 17.3% |