Marshallese vs Belizean Single Father Poverty
COMPARE
Marshallese
Belizean
Single Father Poverty
Single Father Poverty Comparison
Marshallese
Belizeans
16.9%
SINGLE FATHER POVERTY
3.1/ 100
METRIC RATING
234th/ 347
METRIC RANK
16.2%
SINGLE FATHER POVERTY
59.9/ 100
METRIC RATING
159th/ 347
METRIC RANK
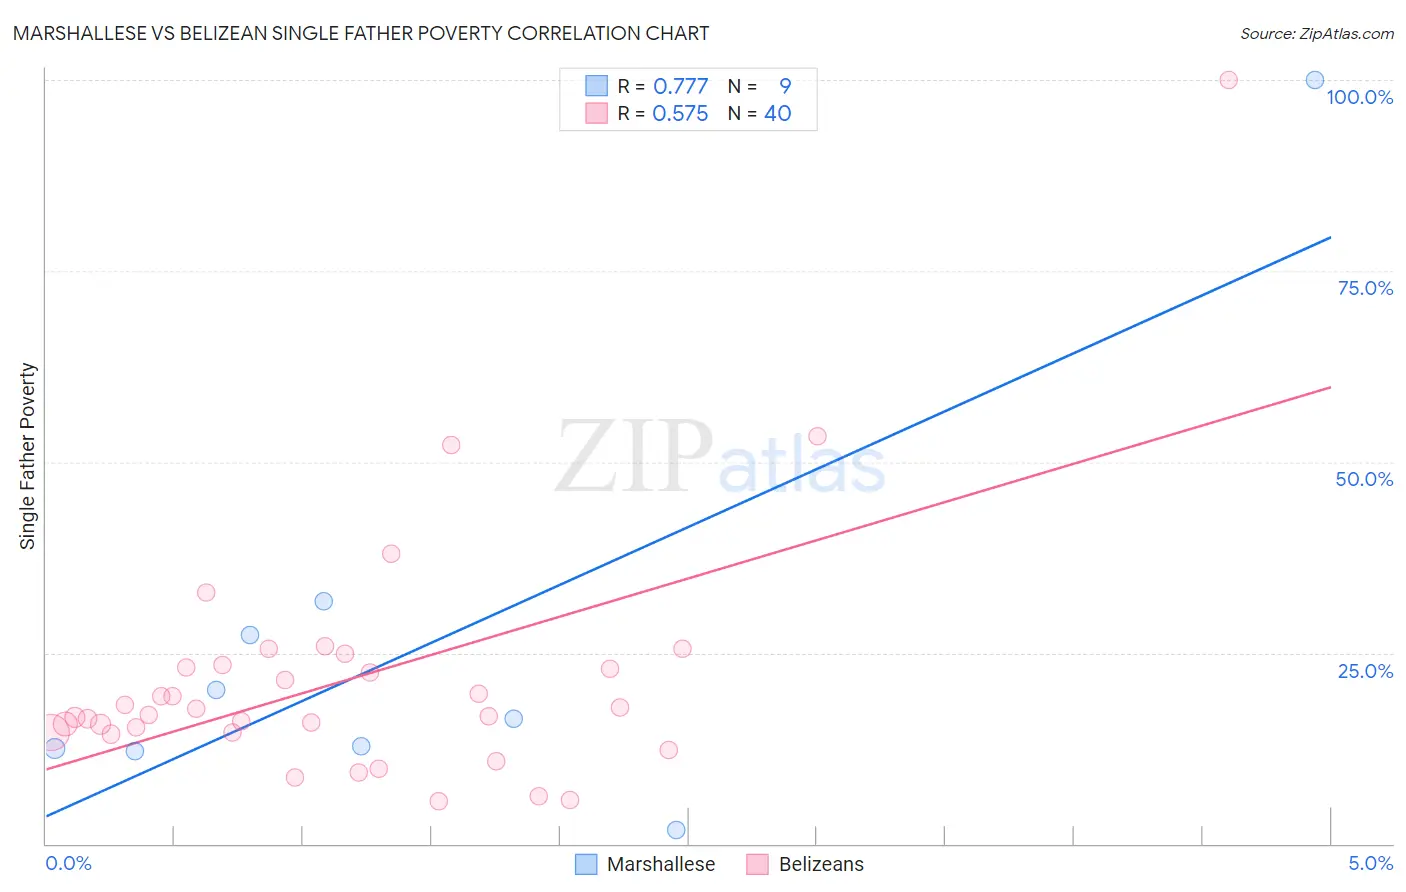
Marshallese vs Belizean Single Father Poverty Correlation Chart
The statistical analysis conducted on geographies consisting of 13,927,336 people shows a strong positive correlation between the proportion of Marshallese and poverty level among single fathers in the United States with a correlation coefficient (R) of 0.777 and weighted average of 16.9%. Similarly, the statistical analysis conducted on geographies consisting of 131,712,008 people shows a substantial positive correlation between the proportion of Belizeans and poverty level among single fathers in the United States with a correlation coefficient (R) of 0.575 and weighted average of 16.2%, a difference of 4.3%.
Single Father Poverty Correlation Summary
| Measurement | Marshallese | Belizean |
| Minimum | 1.9% | 5.6% |
| Maximum | 100.0% | 100.0% |
| Range | 98.1% | 94.4% |
| Mean | 26.1% | 21.5% |
| Median | 16.3% | 17.2% |
| Interquartile 25% (IQ1) | 12.3% | 14.5% |
| Interquartile 75% (IQ3) | 29.5% | 23.2% |
| Interquartile Range (IQR) | 17.2% | 8.7% |
| Standard Deviation (Sample) | 29.1% | 16.4% |
| Standard Deviation (Population) | 27.4% | 16.2% |
Similar Demographics by Single Father Poverty
Demographics Similar to Marshallese by Single Father Poverty
In terms of single father poverty, the demographic groups most similar to Marshallese are Senegalese (16.9%, a difference of 0.030%), Immigrants from Western Europe (16.9%, a difference of 0.10%), Immigrants from Germany (16.9%, a difference of 0.10%), Subsaharan African (16.9%, a difference of 0.10%), and Immigrants from Grenada (16.9%, a difference of 0.17%).
| Demographics | Rating | Rank | Single Father Poverty |
| British | 5.6 /100 | #227 | Tragic 16.8% |
| Belgians | 5.3 /100 | #228 | Tragic 16.8% |
| Israelis | 4.6 /100 | #229 | Tragic 16.8% |
| Immigrants | Trinidad and Tobago | 4.5 /100 | #230 | Tragic 16.8% |
| Spanish Americans | 3.7 /100 | #231 | Tragic 16.9% |
| Immigrants | Grenada | 3.7 /100 | #232 | Tragic 16.9% |
| Senegalese | 3.2 /100 | #233 | Tragic 16.9% |
| Marshallese | 3.1 /100 | #234 | Tragic 16.9% |
| Immigrants | Western Europe | 2.9 /100 | #235 | Tragic 16.9% |
| Immigrants | Germany | 2.9 /100 | #236 | Tragic 16.9% |
| Sub-Saharan Africans | 2.9 /100 | #237 | Tragic 16.9% |
| Immigrants | Saudi Arabia | 2.7 /100 | #238 | Tragic 16.9% |
| Bermudans | 2.6 /100 | #239 | Tragic 16.9% |
| Finns | 2.6 /100 | #240 | Tragic 16.9% |
| Czechs | 2.3 /100 | #241 | Tragic 17.0% |
Demographics Similar to Belizeans by Single Father Poverty
In terms of single father poverty, the demographic groups most similar to Belizeans are Immigrants from Sudan (16.2%, a difference of 0.010%), Portuguese (16.2%, a difference of 0.11%), Immigrants from Czechoslovakia (16.2%, a difference of 0.14%), Estonian (16.2%, a difference of 0.15%), and Ugandan (16.3%, a difference of 0.18%).
| Demographics | Rating | Rank | Single Father Poverty |
| Immigrants | Zimbabwe | 72.1 /100 | #152 | Good 16.1% |
| Immigrants | Israel | 72.0 /100 | #153 | Good 16.1% |
| Mexicans | 70.1 /100 | #154 | Good 16.1% |
| Immigrants | Nicaragua | 67.8 /100 | #155 | Good 16.2% |
| Immigrants | Jordan | 66.0 /100 | #156 | Good 16.2% |
| Immigrants | Czechoslovakia | 62.8 /100 | #157 | Good 16.2% |
| Portuguese | 62.3 /100 | #158 | Good 16.2% |
| Belizeans | 59.9 /100 | #159 | Average 16.2% |
| Immigrants | Sudan | 59.8 /100 | #160 | Average 16.2% |
| Estonians | 56.7 /100 | #161 | Average 16.2% |
| Ugandans | 55.9 /100 | #162 | Average 16.3% |
| Immigrants | Costa Rica | 55.7 /100 | #163 | Average 16.3% |
| Guyanese | 55.2 /100 | #164 | Average 16.3% |
| Immigrants | Bangladesh | 55.1 /100 | #165 | Average 16.3% |
| Immigrants | Europe | 54.8 /100 | #166 | Average 16.3% |