Immigrants from Serbia vs Immigrants from Taiwan Single Father Poverty
COMPARE
Immigrants from Serbia
Immigrants from Taiwan
Single Father Poverty
Single Father Poverty Comparison
Immigrants from Serbia
Immigrants from Taiwan
15.5%
SINGLE FATHER POVERTY
98.5/ 100
METRIC RATING
92nd/ 347
METRIC RANK
13.7%
SINGLE FATHER POVERTY
100.0/ 100
METRIC RATING
7th/ 347
METRIC RANK
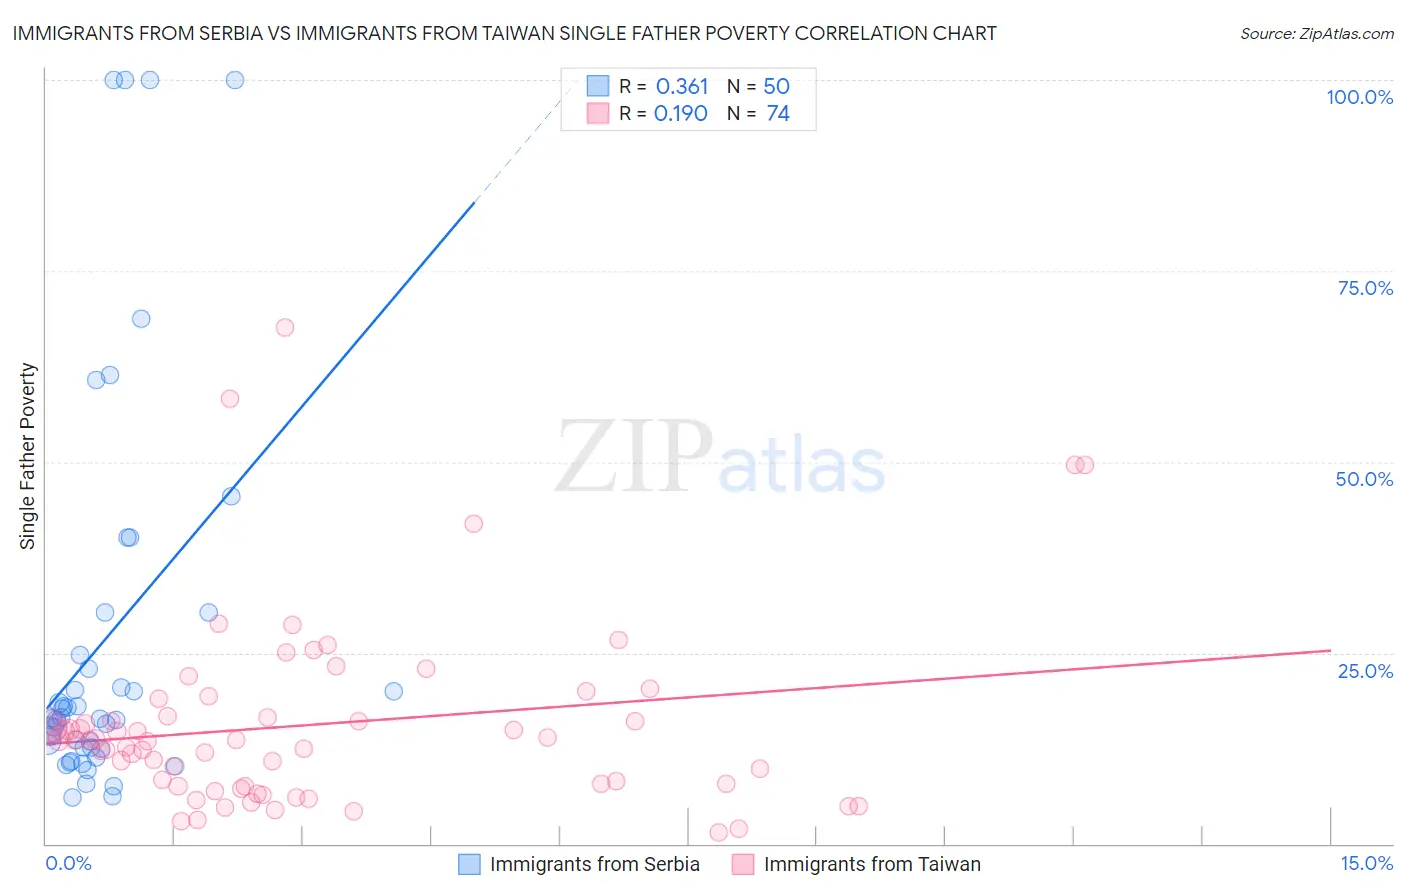
Immigrants from Serbia vs Immigrants from Taiwan Single Father Poverty Correlation Chart
The statistical analysis conducted on geographies consisting of 114,512,326 people shows a mild positive correlation between the proportion of Immigrants from Serbia and poverty level among single fathers in the United States with a correlation coefficient (R) of 0.361 and weighted average of 15.5%. Similarly, the statistical analysis conducted on geographies consisting of 238,751,795 people shows a poor positive correlation between the proportion of Immigrants from Taiwan and poverty level among single fathers in the United States with a correlation coefficient (R) of 0.190 and weighted average of 13.7%, a difference of 13.6%.
Single Father Poverty Correlation Summary
| Measurement | Immigrants from Serbia | Immigrants from Taiwan |
| Minimum | 6.1% | 1.5% |
| Maximum | 100.0% | 67.6% |
| Range | 93.9% | 66.0% |
| Mean | 26.6% | 15.6% |
| Median | 16.4% | 13.6% |
| Interquartile 25% (IQ1) | 12.5% | 7.5% |
| Interquartile 75% (IQ3) | 24.8% | 16.8% |
| Interquartile Range (IQR) | 12.2% | 9.3% |
| Standard Deviation (Sample) | 25.8% | 12.3% |
| Standard Deviation (Population) | 25.6% | 12.2% |
Similar Demographics by Single Father Poverty
Demographics Similar to Immigrants from Serbia by Single Father Poverty
In terms of single father poverty, the demographic groups most similar to Immigrants from Serbia are Basque (15.5%, a difference of 0.040%), Immigrants from Romania (15.5%, a difference of 0.11%), Immigrants from Uruguay (15.6%, a difference of 0.17%), Mexican American Indian (15.5%, a difference of 0.21%), and Immigrants from Kazakhstan (15.6%, a difference of 0.23%).
| Demographics | Rating | Rank | Single Father Poverty |
| Immigrants | Oceania | 99.1 /100 | #85 | Exceptional 15.4% |
| Immigrants | Russia | 99.0 /100 | #86 | Exceptional 15.5% |
| Brazilians | 99.0 /100 | #87 | Exceptional 15.5% |
| Burmese | 99.0 /100 | #88 | Exceptional 15.5% |
| Immigrants | Korea | 99.0 /100 | #89 | Exceptional 15.5% |
| Mexican American Indians | 98.7 /100 | #90 | Exceptional 15.5% |
| Immigrants | Romania | 98.6 /100 | #91 | Exceptional 15.5% |
| Immigrants | Serbia | 98.5 /100 | #92 | Exceptional 15.5% |
| Basques | 98.4 /100 | #93 | Exceptional 15.5% |
| Immigrants | Uruguay | 98.2 /100 | #94 | Exceptional 15.6% |
| Immigrants | Kazakhstan | 98.2 /100 | #95 | Exceptional 15.6% |
| Immigrants | Belgium | 98.1 /100 | #96 | Exceptional 15.6% |
| Yaqui | 98.1 /100 | #97 | Exceptional 15.6% |
| Zimbabweans | 98.1 /100 | #98 | Exceptional 15.6% |
| Immigrants | Middle Africa | 97.4 /100 | #99 | Exceptional 15.6% |
Demographics Similar to Immigrants from Taiwan by Single Father Poverty
In terms of single father poverty, the demographic groups most similar to Immigrants from Taiwan are Samoan (13.8%, a difference of 0.86%), Ethiopian (13.5%, a difference of 1.1%), Immigrants from Ethiopia (13.4%, a difference of 1.8%), Afghan (14.0%, a difference of 2.0%), and Korean (14.0%, a difference of 2.1%).
| Demographics | Rating | Rank | Single Father Poverty |
| Assyrians/Chaldeans/Syriacs | 100.0 /100 | #1 | Exceptional 11.7% |
| Tongans | 100.0 /100 | #2 | Exceptional 12.2% |
| Tsimshian | 100.0 /100 | #3 | Exceptional 12.7% |
| Immigrants | Fiji | 100.0 /100 | #4 | Exceptional 13.2% |
| Immigrants | Ethiopia | 100.0 /100 | #5 | Exceptional 13.4% |
| Ethiopians | 100.0 /100 | #6 | Exceptional 13.5% |
| Immigrants | Taiwan | 100.0 /100 | #7 | Exceptional 13.7% |
| Samoans | 100.0 /100 | #8 | Exceptional 13.8% |
| Afghans | 100.0 /100 | #9 | Exceptional 14.0% |
| Koreans | 100.0 /100 | #10 | Exceptional 14.0% |
| Filipinos | 100.0 /100 | #11 | Exceptional 14.0% |
| Immigrants | India | 100.0 /100 | #12 | Exceptional 14.0% |
| Immigrants | Philippines | 100.0 /100 | #13 | Exceptional 14.0% |
| Immigrants | Vietnam | 100.0 /100 | #14 | Exceptional 14.1% |
| Sri Lankans | 100.0 /100 | #15 | Exceptional 14.2% |